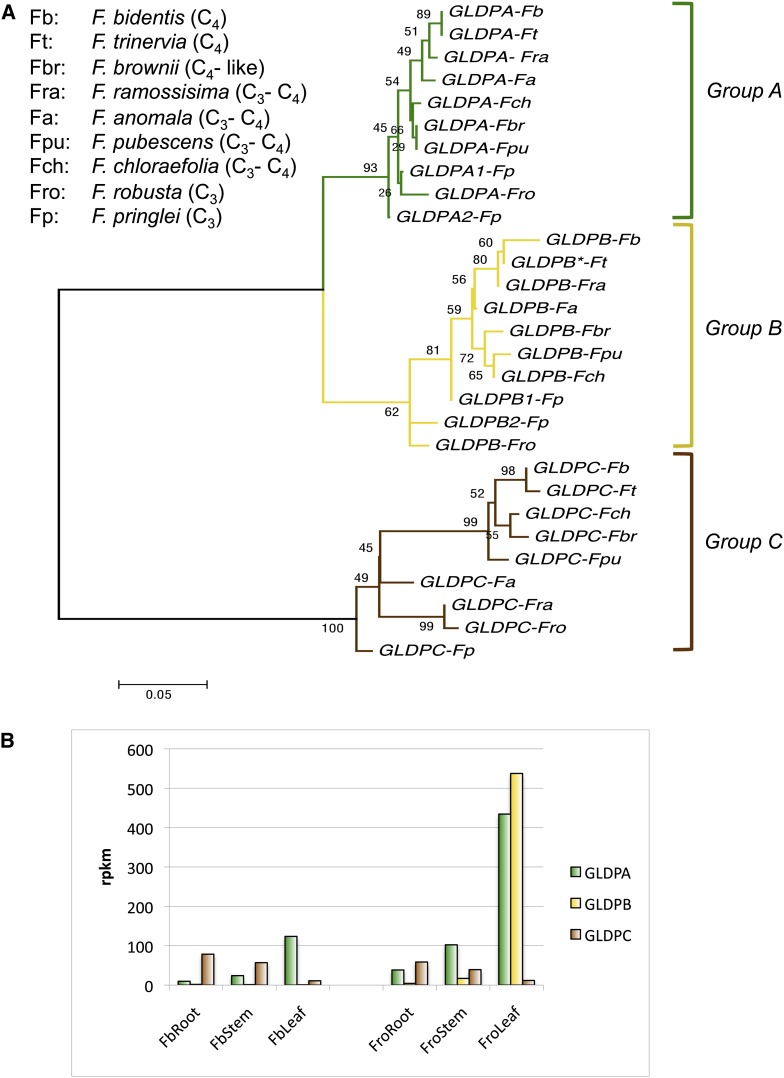
Figure 1.
Molecular Phylogenetic Analysis of GLDP Genes of the Genus Flaveria and GLDP Transcript Abundance in Organs.
(A) Maximum likelihood tree of GLDP sequences in Flaveria. The tree was constructed with MEGA5 (Tamura et al., 2011) using the Tamura 3 parameter model. The tree is drawn to scale, with branch length measured in the number of substitutes per site. The tree is based on 203 nucleotide positions, starting at the ATG, which were aligned using ClustalX 2.0.8 (Higgins and Sharp, 1988, 1989; Thompson et al., 1997; Larkin et al., 2007) (alignment is shown in Supplemental Data Set 1 online). Bootstrap values (1000 replicates) are shown next to the branches (Felsenstein, 1985). Branches corresponding to partitions reproduced in less than 50% of bootstrap replicates are collapsed.
(B) Abundance of GLDPA, GLDPB, and GLDPC transcripts in stems, roots, and leaves of F. bidentis (Fb; C4) and F. robusta (Fro; C3) as measured by mapping RNaseq Illumina reads on the respective cDNAs and expressed in reads per kilobase per million (rpkm).

