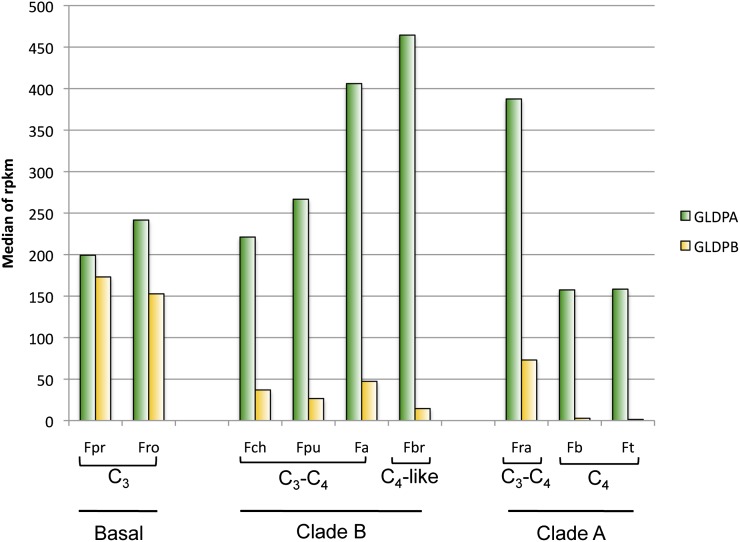
Figure 5.
Transcript Abundance of Group A and Group B GLDP Genes in C3, C3-C4 Intermediate, and C4 Flaveria Species.
The transcript abundance was calculated as the median of four Illumina RNaseq experiments and is expressed in reads per kilobase per million (rpkm). Transcript abundances of group A GLDP genes are displayed in green, and transcript abundances of group B are displayed in yellow. Fp, F. pringlei; Fro, F. robusta; Fch, F. chloraefolia; Fpu, F. pubescens; Fa, F. anomala; Fra, F. ramossisima; Fbr, F. brownii; Fb, F. bidentis; Ft, F. trinervia.

