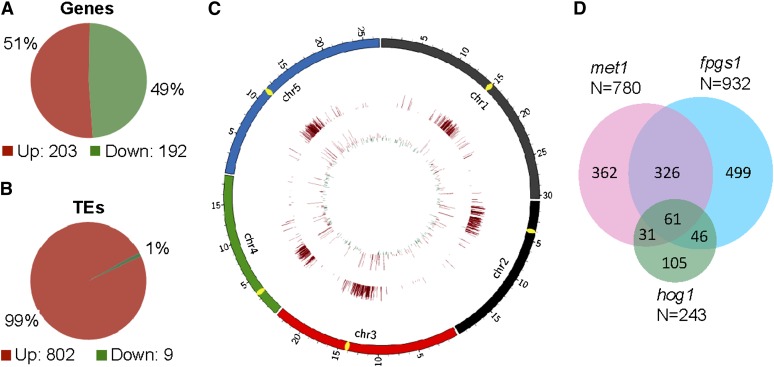
Figure 4.
Characterization of FPGS1-Dependent Loci by RNA Deep Sequencing.
(A) and (B) Diagrams show the numbers of differentially expressed protein-coding genes (A) and TEs (B) caused by fpgs1.
(C) The distribution of differentially expressed protein-coding genes and TEs caused by fpgs1. The transcript levels of genes and TEs are shown in the inside circle and the outside circle, respectively. The outward bars and inward bars represent fpgs1-upregulated loci and -downregulated loci, respectively. The lengths of bars represent the fold changes of differences.
(D) The fpgs1-upregulated Arabidopsis Genome Initiative annotated genes and transposons were compared with the previously reported met1- and hog1-upregulated loci. The numbers of the upregulated loci as well as the number of overlapping loci are shown.

