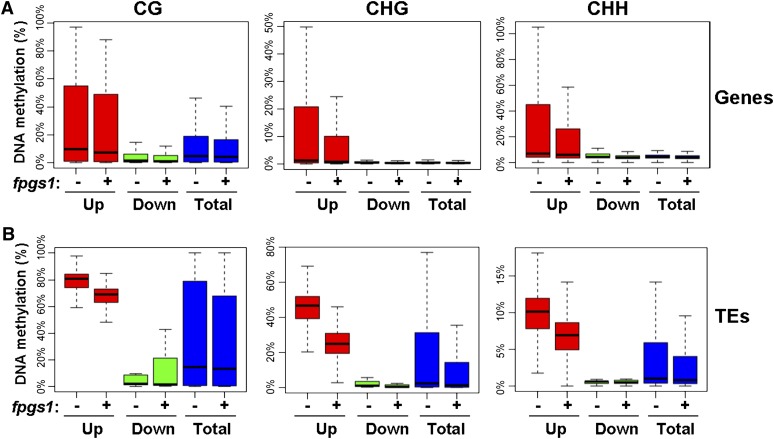
Figure 5.
Box Plot of DNA Methylation Levels in fpgs1-Mediated Differentially Expressed Genes and TEs.
DNA methylation of differentially expressed genes (A) and TEs (B) in ros1 and ros1fpgs1. “−”, ros1; “+”, ros1 fpgs1. “Up” and “Down” represent genes or TEs that are upregulated and downregulated by fpgs1, respectively. “Total” represents total genes or TEs in Arabidopsis. DNA methylation at CG, CHG, and CHH sites was separately indicated.
[See online article for color version of this figure.]

