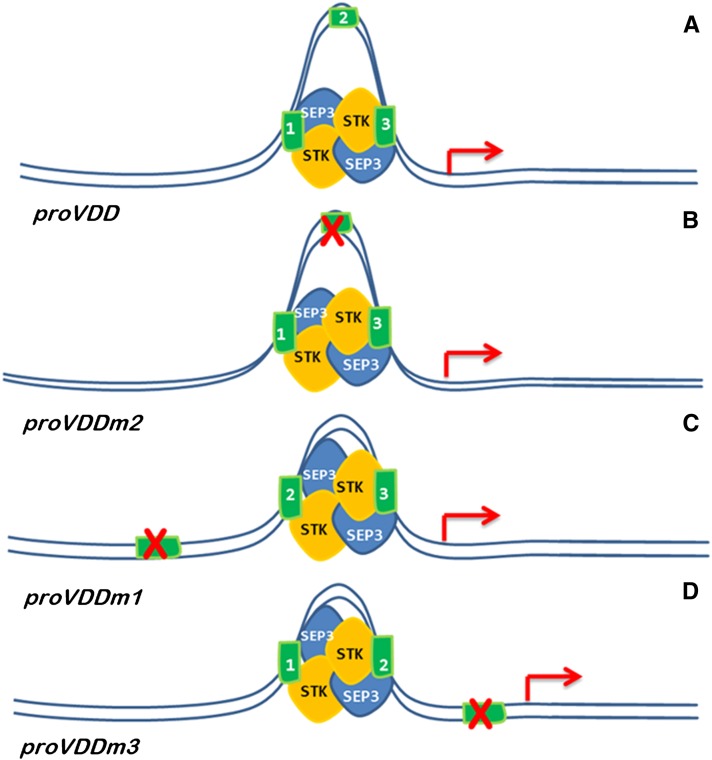
Figure 6.
Schematic Representation of the Predicted Mode of Action of the STK-SEP3 MADS Domain Complex on the VDD Promoter.
Illustration of loop formation in the VDD promoter (A), VDD promoter with the second CArG mutated (B), first CArG mutated (C), and third CArG mutated (D). Cartoon clarifies the putative changes in loop size and position with respect to the transcription start site (red arrow).

