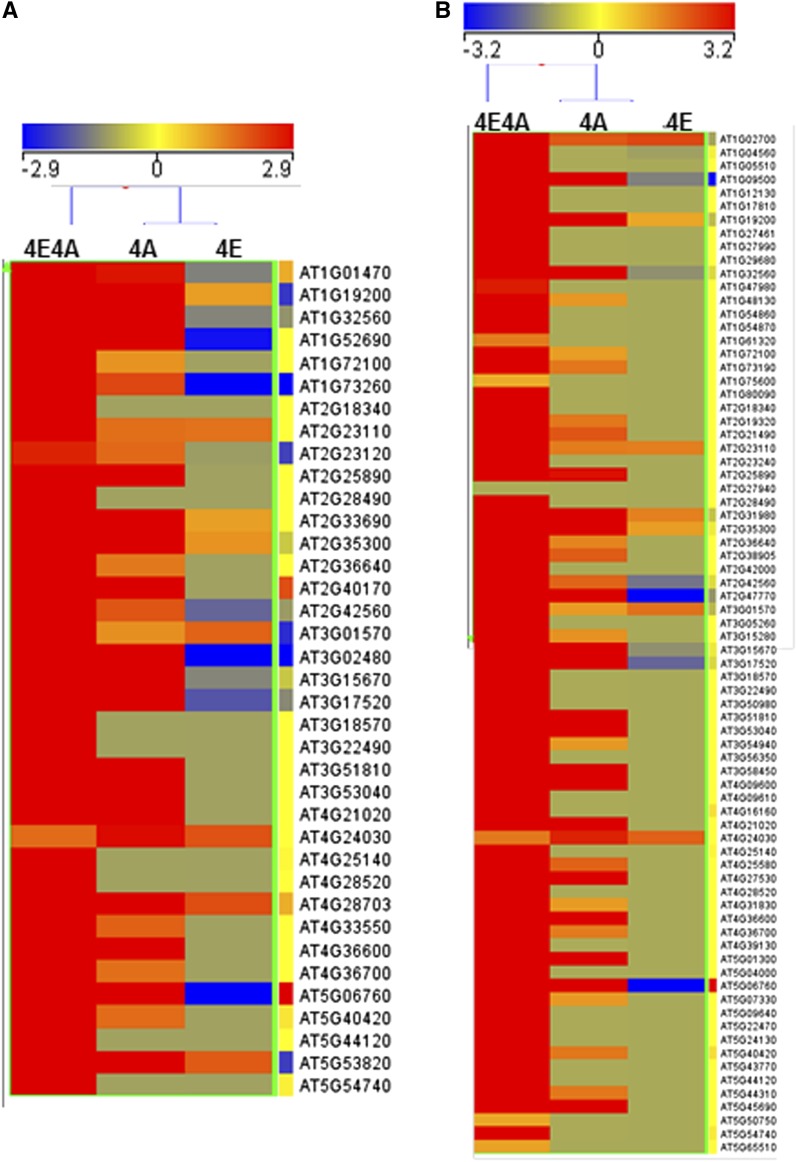
Figure 4.
Analysis of Seed-Specific Arabidopsis Genes Expressed during Activation of the phas Promoter in Leaves.
Relative expression profiles of identified seed storage genes (A) and other seed-specific genes (B). The color indicates the degree of fold change: red, high; blue, low. Hierarchical clustering (heat map) was generated using the Euclidean-based method.

