Figure 6.
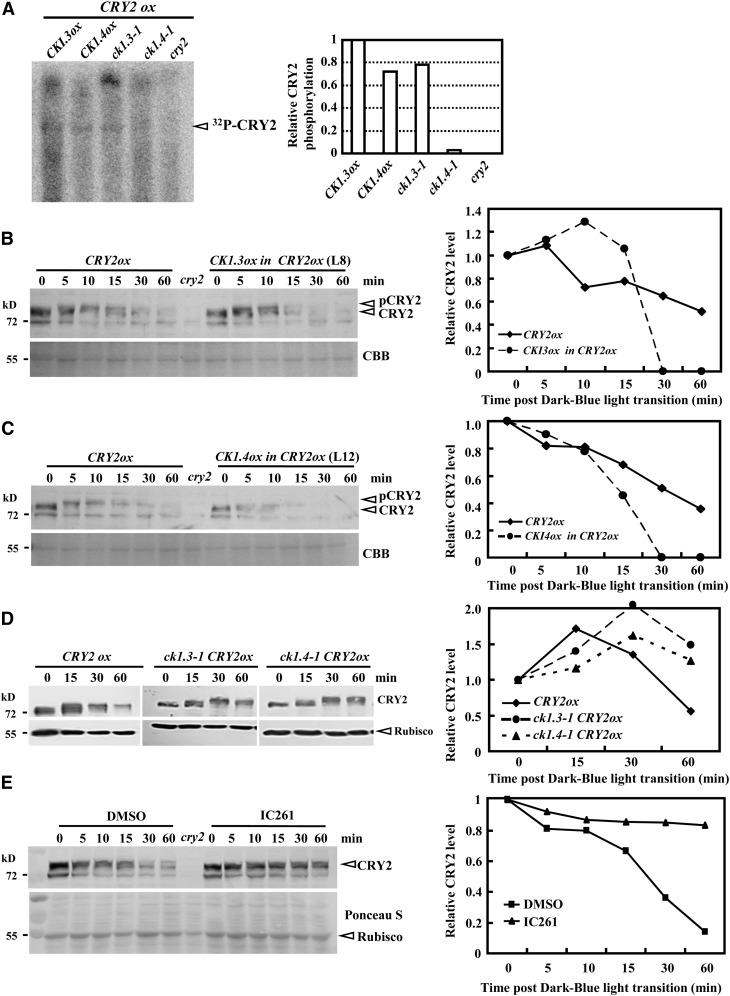
CK1.3 and CK1.4 Stimulate the Blue Light–Dependent Degradation of CRY2.
(A) In vivo assay revealed rescued/suppressed CRY2 phosphorylation under CK1.3 or CK1.4 deficiency. Seven-day-old seedlings under red light (referred to published methods; Shalitin et al., 2002) were incubated with 200 μCi [32P]H3PO4 overnight and then exposed to blue light (6 μ mol/m2/s) for 15 min. Seedlings (1 g) were collected to extract crude protein for immunoprecipitation and autoradiography (left panel). The relative CRY2 phosphorylation level was calculated by comparing the signal strength of the CRY2 band (right panel; calculated by the Tanon Gis 1D program). The quantity of CRY2 in CK1.3ox was set as 1.0.
(B) and (C) Protein gel blot analysis revealed a significant increase of CRY2 degradation when exposed to blue light (10 µmol/m2/s) under enhanced expression of CK1.3 (B) or CK1.4 (C). Equal amounts of proteins (∼10 μg) were used for blotting (confirmed by Coomassie blue [CBB] staining). The relative protein level was calculated by comparing the signal strength of the CRY2 band to the ribulose-1,5-bis-phosphate carboxylase/oxygenase band in the Coomassie blue PAGE gel (right panels; calculated by the Tanon Gis 1D program). The quantity at time “0” was set as 1.0, similarly in (D) and (E).
(D) Protein gel blot analysis (left panel) revealed that CRY2 degradation was significantly reduced in ck1.3-1 or ck1.4-1 when exposed to blue light (10 µmol/m2/s). Equal amounts of proteins (∼10 μg) were used for blotting (confirmed by the similar intensities of a nonspecific band).
(E) Compared with the degradation of CRY2 under blue light (10 µmol/m2/s; 5, 10, 15, 30, and 60 min after dark-blue light transition), IC261 treatment (50 µM) significantly suppressed CRY2 degradation. Equal amounts of proteins (∼10 μg) were used for blotting (confirmed by Coomassie blue staining). DMSO was used as a control.

