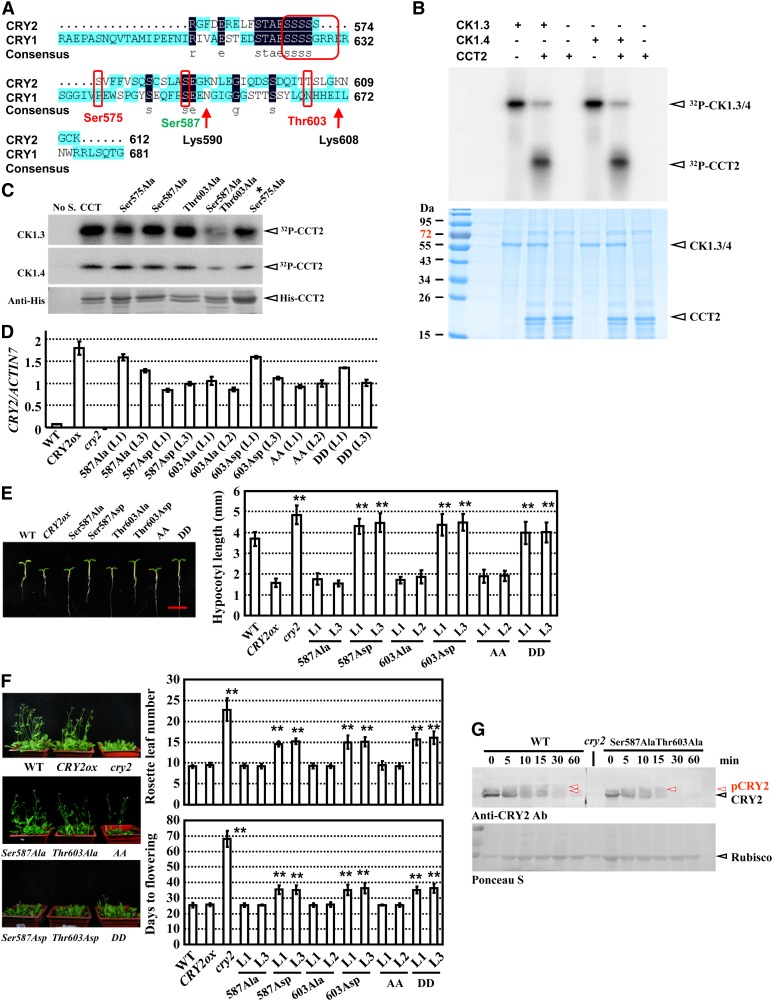
Figure 7.
Phosphorylation of Ser-587 and Thr-603 by CK1.3 and CK1.4 Suppresses CRY2-Mediated Photomorphogenesis.
(A) Presence of multiple candidate CK1 phosphorylation sites in the C terminus of CRY2 and CCT2, including Ser570-575, Ser-587, and Thr-603 (highlighted by red circles). Prediction analysis was performed via integrating two programs (http://www.cbs.dtu.dk/services/NetPhosK and http://scansite.mit.edu/motifscan_seq.phtml). Lys-590 and Lys-607 are two candidate ubiquitination sites in CCT2 (not in CCT1; i.e., the C terminus of CRY1). The same amino acids are indicated with a dark-blue background, and highlighted (consensus), and similar amino acids are indicated with a light-blue background.
(B) Kinase activity assay by [γ-32P]ATP autoradiography indicated that CK1.3 and CK1.4 phosphorylated CCT2 in vitro (top panel). Purified recombinant His-CCT2 fusion protein was used for the assay. Input of His-CCT2 was detected by Coomassie blue staining (bottom panel). Arrows indicate the positions of CK1.3 and CK1.4 or CCT2, respectively.
(C) Kinase assay by [γ-32P]ATP autoradiography indicated that Ser-587 and Thr-603 are the phosphorylation sites of CK1.3 and CK1.4 in vitro (top panels). Purified recombinant 6XHis-CCT2s (Ser575Ala, Ser587Ala, Thr603Ala, Ser587Ala Thr603Ala, and Ser570-575Ala as *Ser575Ala) proteins were used for the assay. Input of 6XHis-CCT2 was detected with an antibody against His-tag (bottom panel). No S, no substrate.
(D) qRT-PCR analysis confirmed the expression of CRY2 (different versions, including dephosphorylated status Ser587Ala, Thr603Ala, and AA [Ser587Ala and Thr603Ala] and constitutively phosphorylated status Ser587Asp, Thr603Asp, and DD [Ser587Asp and Thr603Asp]) in transgenic lines. ACTIN7 was used as a positive internal reference. The data are presented as the average ± se. The experiments were repeated three times. WT, the wild type.
(E) Growth of 7-d-old seedlings of wild-type, CRY2ovx, and seedlings overexpressing different point-mutated CRY2s under blue light (left panel, representative images are shown, bar = 5 mm). Hypocotyl lengths were measured and statistically analyzed (**P < 0.01; right panel). Error bars represent sd (n > 15).
(F) Growth of 40-d-old plants of wild-type, CRY2ox, cry2 mutant, and transgenic seedlings as described in (E) under LD conditions (left panel; representative images are shown). Days of flowering were measured and statistically analyzed (**P < 0.01; right panel). Error bars represent sd (n > 15).
(G) Protein gel blot analysis revealed that mutations at Ser587Ala and Thr603Ala resulted in a significant decrease of CRY2 phosphorylation when exposed to blue light. Seven-day-old etiolated seedlings of CRY2ox or CRY2 Ser587AlaThr603Alaox lines were exposed to blue light (10 μmol/m2/s) and used for protein extraction. Equal amounts of proteins (∼10 μg) were used for blotting (confirmed by Ponceau S staining; bottom panel). Rubisco, ribulose-1,5-bisphosphate carboxylase/oxygenase.

