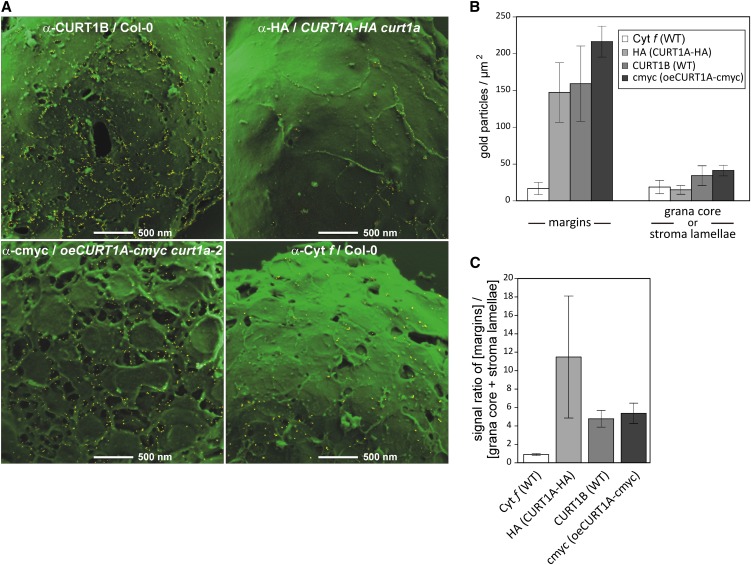
Figure 7.
CURT1 Proteins Are Enriched at Grana Margins.
(A) Scanning electron microscopy images of envelope-free chloroplasts from wild-type (Col-0), CURT1A-HA curt1a-2, and oeCURT1A-cmyc curt1a-2 plants, following immunogold labeling with antibodies raised against CURT1B, cytochrome f, HA, and cmyc. Bars = 500 nm.
(B) Quantification of the distribution of immunogold-labeled CURT1 proteins. At least eight independent scanning electron microscopy pictures of each experiment, as exemplarily shown in (A), were analyzed for the distribution of signals from gold particles. “Margins” were defined as the area covering around 5 nm in both directions of the visual membrane bending zones. The residual surface was combined to represent the grana core and stroma lamellae regions. Note that the minor amounts of CURT1 proteins in Col-0 and oeCURT1A-cmyc plants assigned to the grana core or stroma lamellae regions were also mainly detected close to the curved membrane borders but just outside of the region arbitrarily defined as “margins.” Error bars represent the sd between the independent scanning electron microscopy images. WT, the wild type.
(C) The distribution ratios of the CURT1 proteins and, as control, cytochrome f were determined based on the specific accumulation of gold particles in the margins or the remaining membrane area (grana core + stroma lamellae) of the same scanning electron microscopy images analyzed in (B). Error bars represent sd as in (B).

