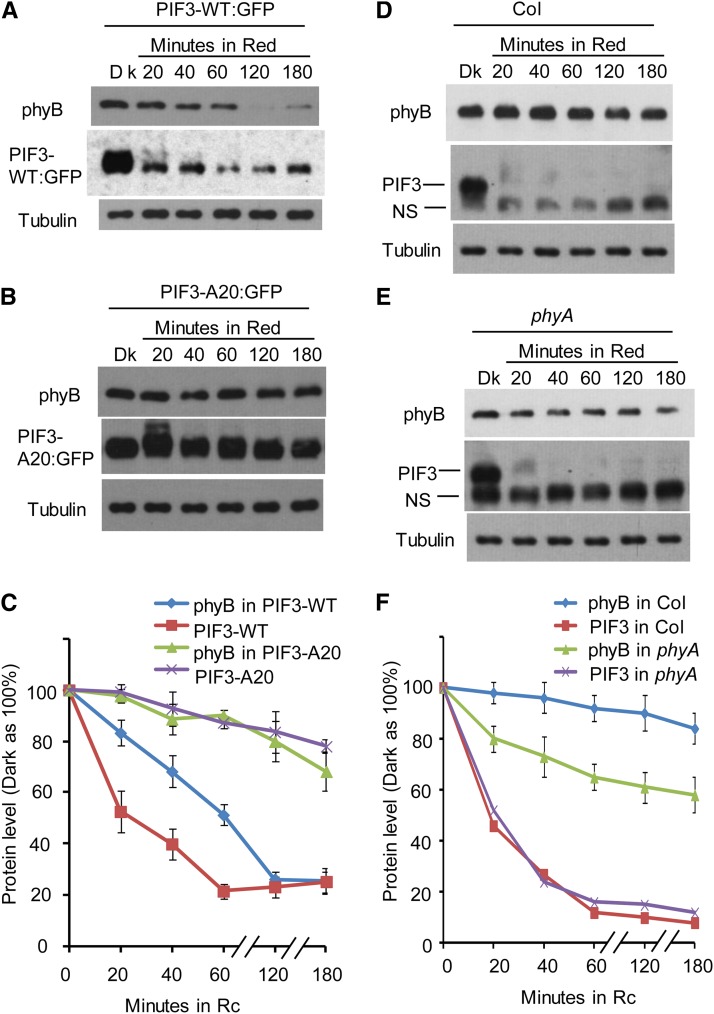
Figure 7.
Light-Induced phyB Degradation Kinetics Correlate Robustly with the Differential Rates of Degradation Displayed by the Wild-Type and Phosphorylation Refractory A20 PIF3 Mutant Proteins.
(A) The PIF3-WT overexpression transgenic line shows rapid light-induced degradation of both phyB and PIF3-WT. Three-day-old, dark-grown PIF3-WT:GFP–expressing seedlings were either kept in the dark (Dk) or exposed to continuous R light for the periods indicated. Extracted proteins were subjected to immunoblot analysis using either anti-phyB, anti-GFP, or antitubulin antibodies.
(B) The PIF3-A20 overexpression line shows comparatively slower light-induced degradation of both phyB and PIF3-A20. Seedlings were grown, exposed to light, and analyzed as in (A).
(C) Quantification of phyB and PIF3-GFP degradation kinetics in the PIF3-WT:GFP and PIF3-A20:GFP lines, from replicated immunoblot scans. Dark protein levels were set at 100% for each protein. Data are represented as the mean of biological triplicates ± se. Rc, continuous R light.
(D) Light-induced phyB degradation in wild-type Col is relatively slow. Col seedlings were grown and treated with R light as in (A) before protein extraction and immunoblot analysis using antibodies against phyB, PIF3, or tubulin.
(E) R light–induced phyB degradation in the phyA mutant is faster than that in Col. phyA seedling growth, R light treatment, and immunoblot analysis were the same as for the Col seedlings in (D).
(F) Quantification of phyB and PIF3 degradation kinetics in Col and the pif3 mutant. Dark protein levels were set at 100% for each protein. Data are represented as the mean of biological triplicates ± se.
[See online article for color version of this figure.]

