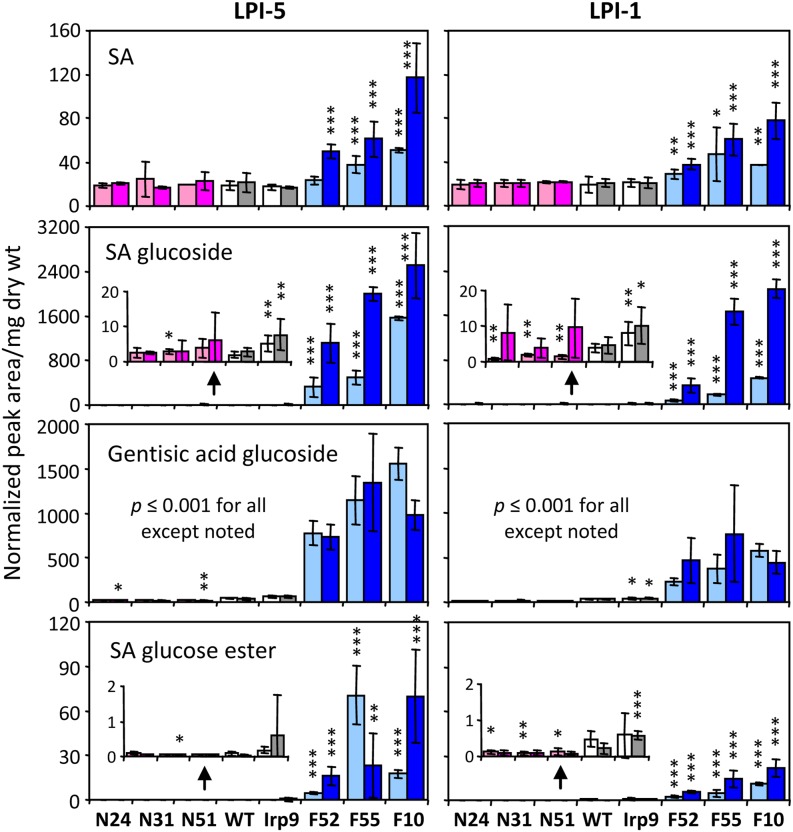
Figure 4.
Relative Abundance of SA and SA-Related Conjugates.
Samples are color-coded by plant group. Lighter and darker bars denote normal and high temperatures, respectively. Values are means ± sd of n = 7 to 10 for wild-type (WT) and Irp9 plants, n = 2 to 3 for FD-Irp9 (F) lines, and n = 3 to 5 for NahG (N) lines. Statistical significance between wild-type and individual transgenic lines was evaluated by the two-sample t test (***P ≤ 0.001, **0.001< P ≤ 0.01, and *0.01< P ≤ 0.05). dry wt, dry weight.
[See online article for color version of this figure.]

