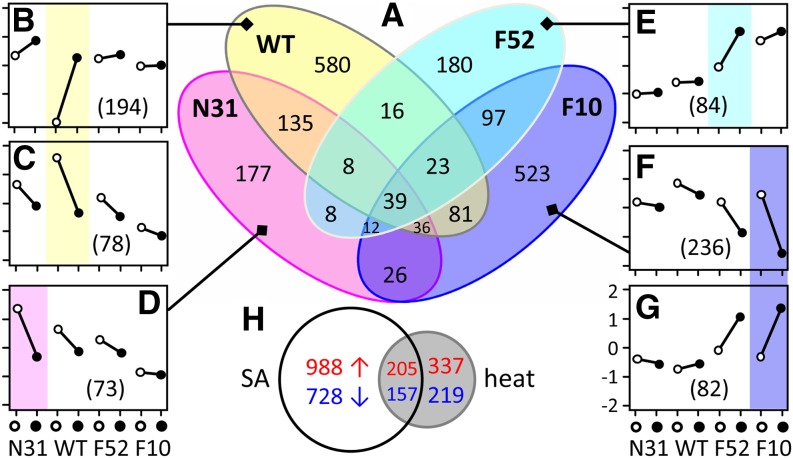
Figure 7.
Gene Expression Responses to Heat Treatment in Wild-Type and Transgenic Lines.
(A) Venn diagram of genes significantly affected by heat in the four genotypes. WT, the wild type.
(B) to (G) Representative patterns of gene expression profiles based on clustering analysis of gene subsets from (A). The average expression profiles of the four genotypes are shown in each panel, with gene number listed in parentheses. Genes exhibiting significant differences are shaded by genotype according to the Venn diagram in (A). Open and filled circles denote normal and high temperature treatments, respectively. y axis in (G) is for (B) to (G).
(H) Venn diagram of genes significantly changed in F10 relative to the wild type (SA effect) or by heat treatment in the wild type (heat effect).
[See online article for color version of this figure.]

