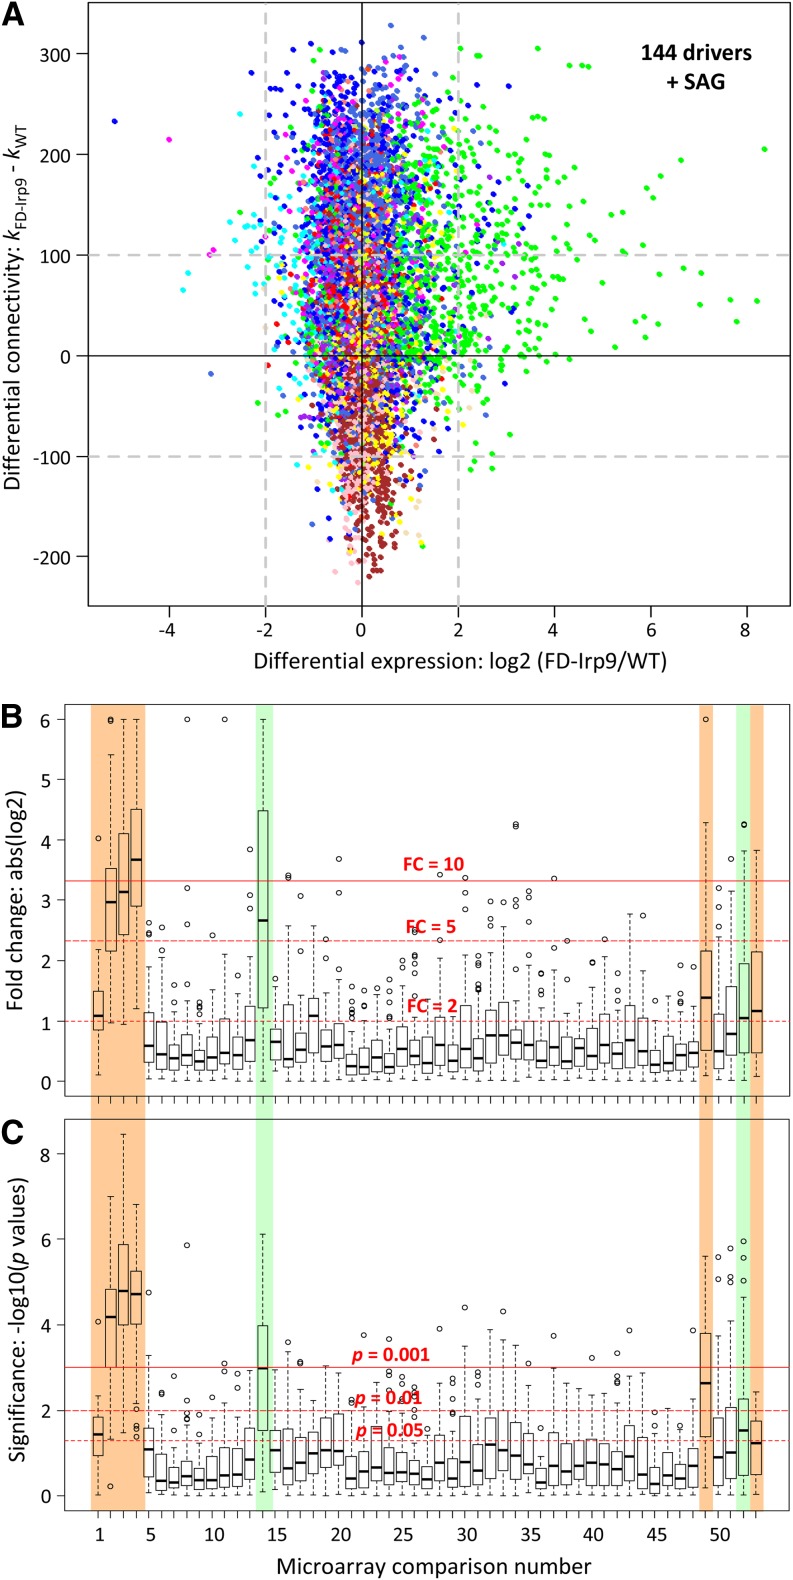
Figure 9.
Graphic Representation of Potential Drivers in the SA-Modulated Gene Network.
(A) Scatterplot of differential expression and differential connectivity between the wild-type (WT) and FD-Irp9 subnetworks. Nodes are colored by their module assignment in the total network. Dashed lines denote the arbitrary cutoffs for the two parameters. Potential drivers that exhibited increased expression and increased network connectivity in the FD-Irp9 plants relative to the wild type are found on the top right corner (144 genes plus the SAG node).
(B) and (C) Expression responsiveness of the driver genes to oxidative stress treatments based on meta-analysis of published Populus leaf microarray data. Gene expression differences between stressed samples and their respective controls were assessed by fold change (FC; [B]) or statistical significance (P value; [C]). Horizontal red lines depict three arbitrary thresholds in each panel. Stress experiments that triggered significant changes in driver gene expression are shaded in color and include SA and/or heat (Nos. 1 to 4; this study), wounding (No. 14), drought (No. 49), pathogen infection (No. 52), and ozone (No. 53). See Supplemental Table 4 online for the complete list of comparisons and data source.

