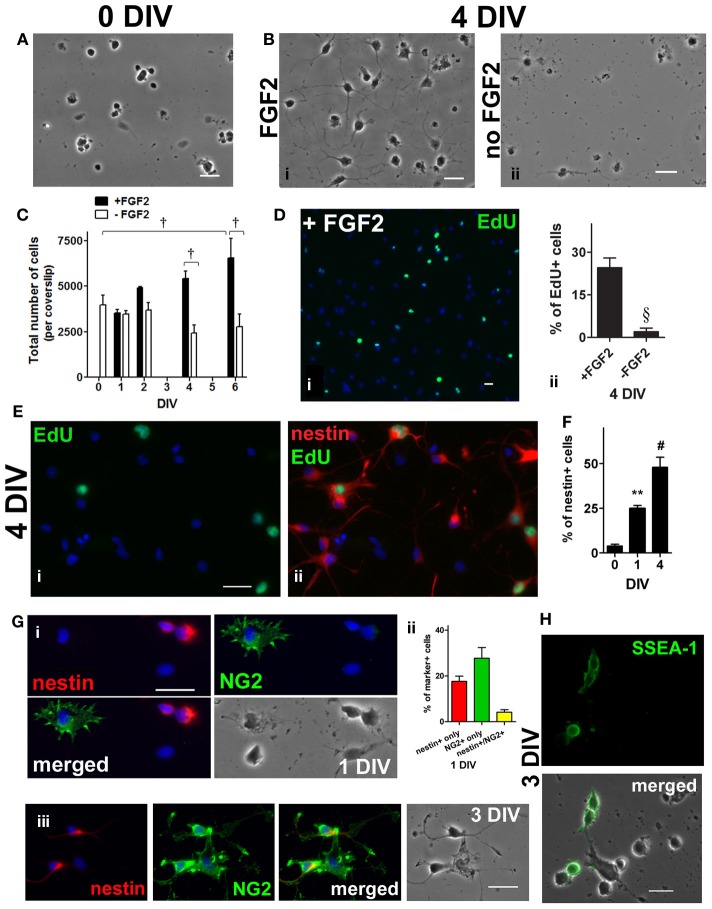
Figure 1.
Enrichment of adult rat spinal cord neural stem/progenitor cells (NSPCs) in culture. (A) Dissociated adult spinal cord cells, 1 h after isolation. (B) Spinal cord cells after 4 days in FGF2 (i) or in basal medium (ii). (C) Adult spinal cord cells proliferated as the total cell number per coverslip increased over time in culture medium containing FGF2 [all the cells in each coverslip were counted, n = 3 coverslips; †P < 0.001 compared with 0 days in vitro (DIV), and between 4 DIV and 6 DIV ± FGF2, One-Way ANOVA Dunnett's multiple comparison post-test]. (D) A thymidine analogue, EdU, was added to culture medium at 4 DIV, 6 h before fixation. Proliferating (actively dividing) cells were EdU-labeled (green) during the 6 h pulse (i). Blue indicates Hoechst-stained nuclei. (ii) Quantification of the percentage of EdU+ cells (10 random fields with a 40× objective per coverslip were analyzed, n = 3 coverslips; §P < 0.005, unpaired t-test). (E) Co-labeling of EdU and nestin showing that some of the NSPCs (4 DIV) were actively dividing. EdU was added to culture medium for only 6 h before fixation at 4 DIV. (i) Proliferating (EdU+) cells (green) during the 6 h pulse. (ii) Merged picture of the green and red channels showing EdU (green) and nestin (red) staining. Blue indicates Hoechst-stained nuclei. (F) Quantification of the percentage of nestin+ cells showing that the population of NSPCs was enriched in culture medium containing FGF2 over time (20 random fields with a 40× objective per coverslip were analyzed, n = 4 coverslips; **P < 0.01, #P ≤ 0.0001, One-Way ANOVA Dunnett's multiple comparison post-test). (G) Co-labeling of NG2 chondronitin sulfate proteoglycan (green) and nestin (red) at 1 DIV (i) and 3 DIV (iii). At 1 DIV, most of the NG2+ cells had distinct morphology from nestin+ cells; while cells coexpressing both markers were observed at 1 and 3 DIV. Blue indicates Hoechst-stained nuclei. (ii) Quantification of the percentage of nestin+, NG2+, and nestin+/NG2+ cells at 1 DIV (20 random fields with a 40× objective per coverslip were analyzed, n = 4 coverslips). (H) At 3 DIV, stage-specific embryonic antigen 1 (SSEA-1) (green), a cell surface carbohydrate epitope found on uncommitted NSPCs, appeared to localize to the plasma membrane of cells with undifferentiated morphology. All scale bars: 20 μm.

