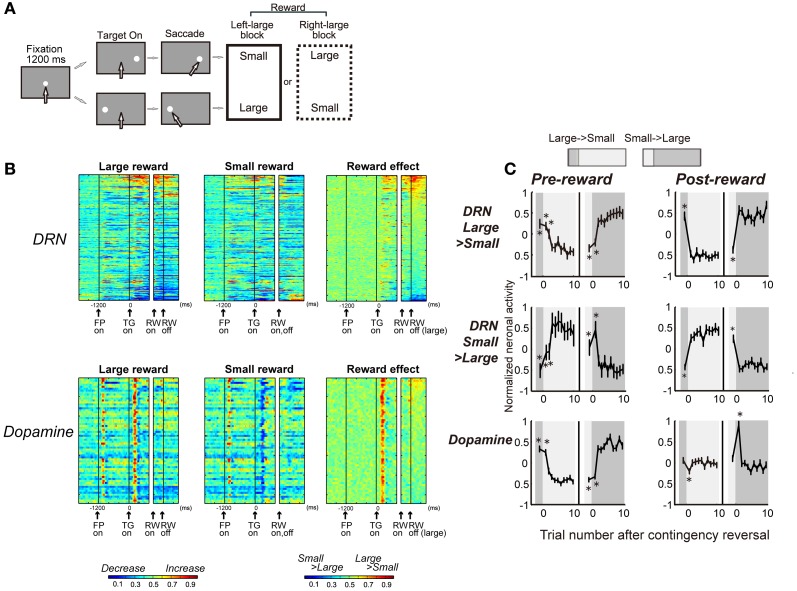
Figure 4.
DRN neurons and dopamine neurons encode different aspects of the reward. (A) Visually guided version of the one direction rewarded saccade (1DR-VGS) task. (B) Activity of 167 DRN neurons and 64 dopamine neurons for the 1DR-VGS task. The same format is used as in Figure 2E. (C) Changes in neuronal activity with the reversal of position-reward contingency. Top and middle: DRN neurons with large- and small-reward preferences, respectively. Bottom: dopamine neurons. For each group, the activity during the pre-reward period (400 ms after target onset) is shown on the left, and the activity during the post-reward period (400–800 ms after reward onset for DRN neurons; 0–400 ms after reward onset for dopamine neurons) is shown on the right. For each graph, the left panel shows large-to-small reward reversal; the right panel shows small-to-large reward reversal. The large-reward trials are indicated by dark gray; the small-reward trials are indicated by clear areas (as in the top). Shown are the mean and SE of the normalized neuronal activity for the n-th trial after contingency reversal. The asterisks (*) indicate activity that was significantly different from the activity in the last five trials of the block with the reversed contingency (p < 0.01, Mann-Whitney U-test). Modified from (Nakamura et al., 2008).

