
Table 5.
Association between PvuII polymorphism and clinical characteristics in control group after controlling age and sex by logistic regressions
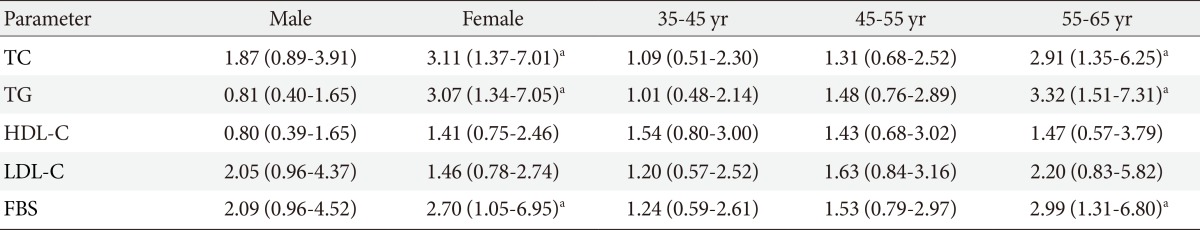
Values are presented as odds ratio (95% confidence interval).
TC, total cholesterol; TG, triglyceride; HDL-C, high density lipoprotein cholesterol; LDL-C, low density lipoprotein cholesterol; FBG, fasting blood glucose.
aP<.05, three age groups had been controlled by sex, and female and male groups had been controlled by age.