
Figure 1.
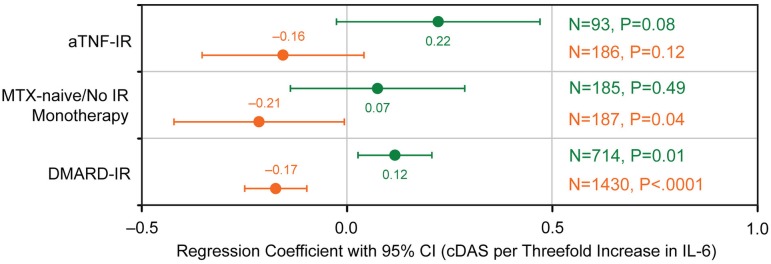
Serum interleukin 6 (IL-6) concentration association with response to treatment. Forest plots show the effect and 95% CI for the association of IL-6 with cDAS28 at 16 weeks across treatment lines. cDAS28, change in DAS28 from baseline at week 16; CI; DMARD, disease-modifying antirheumatic drug; IR, inadequate responder; MTX, methotrexate; SD; TCZ, tocilizumab; TNF, tumour necrosis factor;  , MTX/DMARD;
  , TCZ+MTX/DMARD.