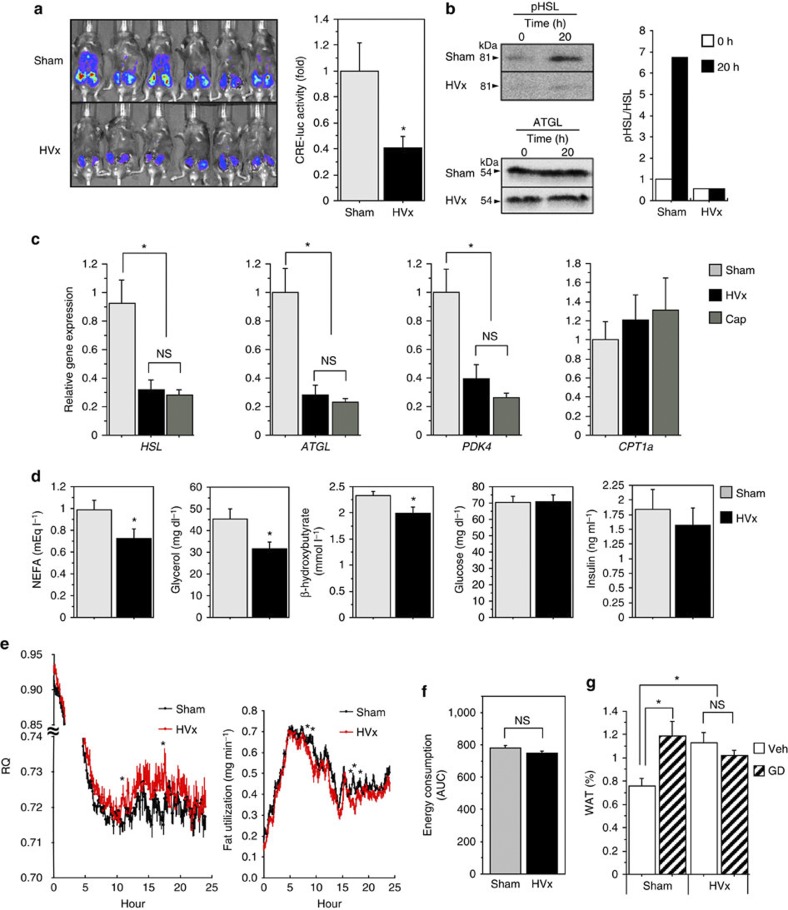
Figure 2. Vagotomy suppresses sympathetic nerve-mediated lipolysis.
(a),Ad-CRE-luc activities in adipose tissue visualized using IVIS Imaging System after 20 h of fasting. *P<0.05 versus sham group (by Student’s t-test) (n=6). (b) Left, protein expressions assessed by western blot analysis using specific antibodies for Ser 563 phospho-HSL (p-HSL) and ATGL in epididymal adipose tissue of sham and HVx mice after 0 and 20 h of fasting. Right, quantification of the blot (ratio of p-HSL to total HSL) (n=5 pooled). (c) mRNA expressions in epididymal fat of 24 h fasting animals, examined by real-time quantitative PCR (RT–qPCR). *P<0.05 versus sham group (by Tukey’s post-hoc test) (n=7). (d) Circulating non-esterified fatty acid (NEFA), glycerol, β-hydroxybutyrate, glucose and insulin levels after 20 h of fasting. *P<0.05 versus sham group (by Student’s t-test) (n=4–9). (e,f) Respiratory quotient (RQ), fat utilization and energy consumption measured using a calorimetric system. *P<0.05 versus sham group (by Student’s t-test) (n=15–18). (g) Weight of remnant epididymal fat tissue in sham or HVx mice with or without guanethidine (GD) treatment after 24 h fasting. *P<0.05 versus sham group (by Tukey’s post-hoc test) (n=6–10). NS, not significant. Error bars, s.e.m.

