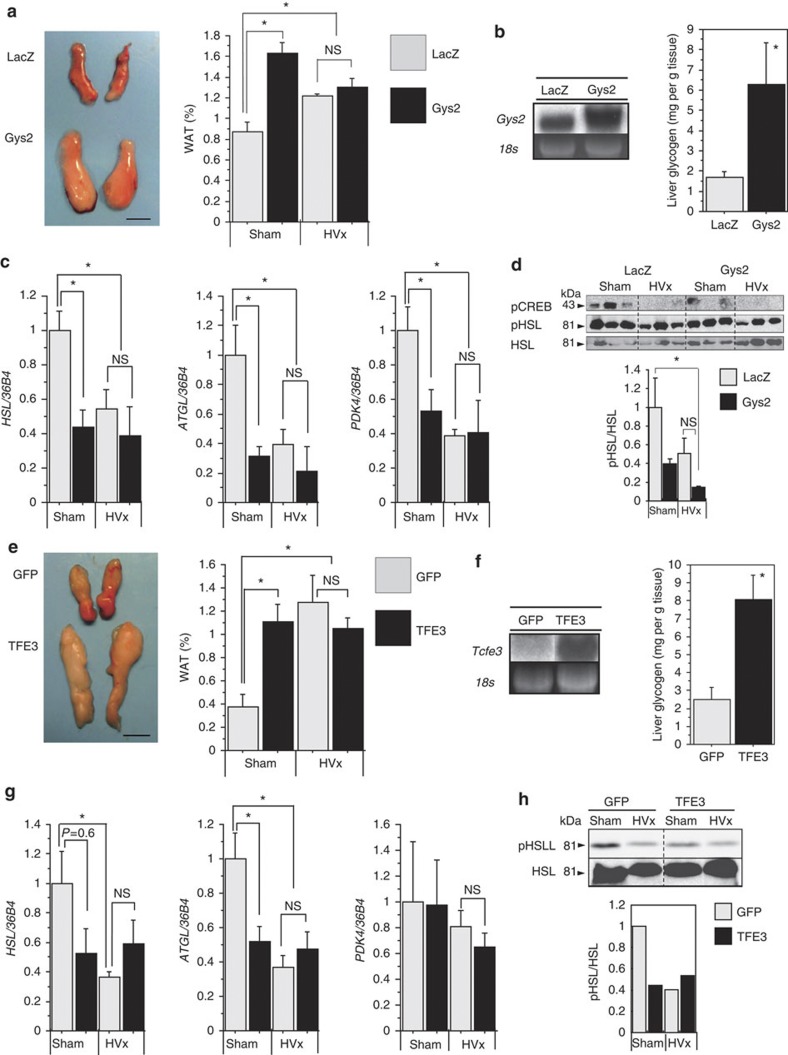
Figure 3. Hepatic glycogen loading cancels liver–brain–adipose axis activation.
(a,e) Gross appearance and weight of epididymal fat in Ad-CMV-Gys2 (a) or Ad-CMV-TFE3 (e) injected mice (filled bars) compared with control (grey bars; Ad-CMV-LacZ/GFP). Scale bar, 5 mm. *P<0.05 versus Ad-CMV-LacZ/GFP-treated sham group (by Tukey’s post-hoc test) (n=5–9). (b,f) Northern blots verifying Gys2 or TFE3 overexpression (three individual liver RNA samples pooled) and hepatic glycogen content in mice infected with Ad-CMV-Gys2 or Ad-CMV-TFE3. *P<0.05 versus Ad-CMV-LacZ/GFP-treated group (by Student’s t-test) (n=5–14). (c,g) RT–qPCR analyses of HSL, ATGL and pyruvate dehydrogenase kinase 4 (PDK4) mRNA expression of epididymal fat in Gys2- or TFE3-overexpressing mice in starvation. *P<0.05 versus Ad-CMV-LacZ/GFP-treated sham group (by Tukey’s post-hoc test) (n=4–9). (d,h) Protein expression of Ser 563 p-HSL and total HSL in epididymal adipose tissue of Gys2- or TFE3-overexpressing mice. (n=3 or three individual protein samples pooled). All mice are analysed on 24-h fasting condition. *P<0.05 versus Ad-CMV-LacZ-treated sham group (by Tukey's post-hoc test). NS, not significant. Error bars, s.e.m.

