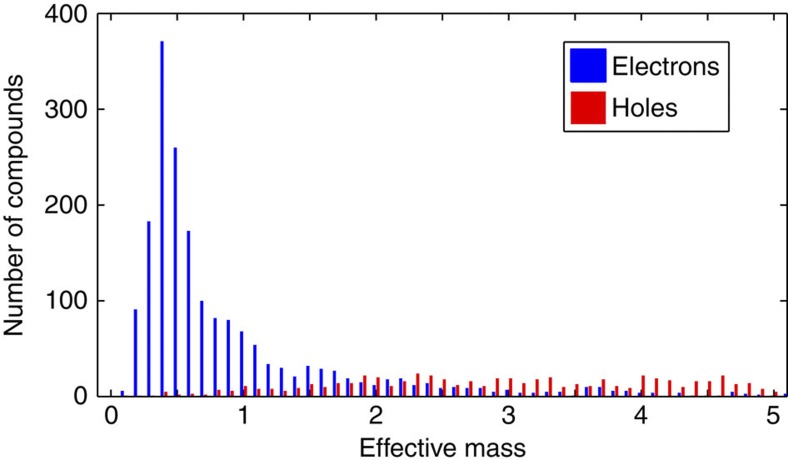
Figure 1. Effective mass distribution for electrons and holes in oxides.
The histogram shows the maximum line effective mass for holes (valence band) in red and electrons (conduction band) in blue in our set of binary and ternary oxides. The effective mass bin size is 0.2 and the figure focuses on the region of low effective mass (lower than 5).

