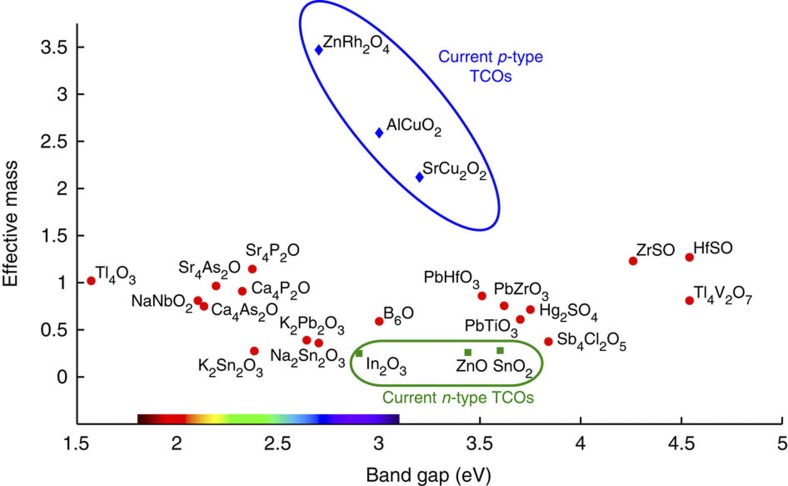
Figure 2. Effective mass versus band gap for the p-type TCO candidates.
We superposed on the band gap axis a colour spectrum corresponding to the wavelength associated with a photon energy. The TCO candidates are marked with red dots. A few known p-type (blue diamonds) and n-type (green square) TCOs can be compared to the new candidates. The best TCOs should lie in the lower right corner. For clarity, we kept only one representative when polymorphs existed for a given stoechiometry (for example, PbTiO3 and K2Sn2O3) and did not plot Rb2Sn2O3, which is superposed on K2Sn2O3.

