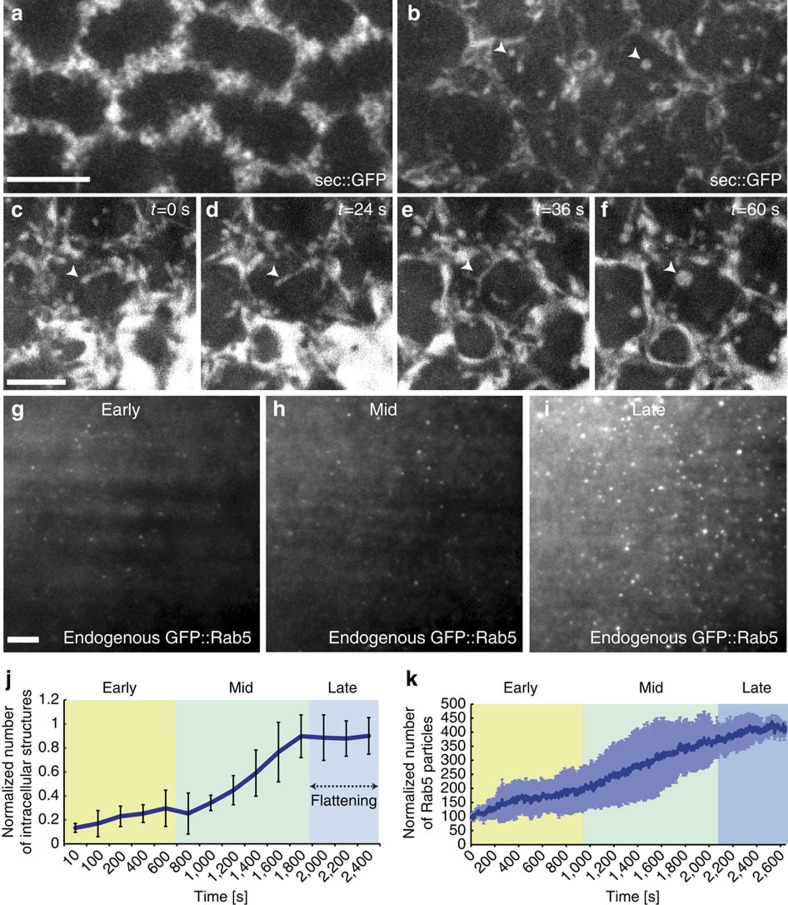
Figure 2. Apical Rab5 endocytosis is upregulated during cellularization and coincides precisely with the timing of apical flattening.
(a,b) Still frames from a time-lapse recording showing the upregulation of sec::GFP internalization. During early cellularization (a) sec::GFP localizes primarily to the extracellar space, whereas during late cellularization numerous internal sec:GFP-positive structures could easily be detected (b, white arrows) Scale bar, 5 μm. (c–f) Still frames from a 3.5 μm z projection time-lapse recording under the apical surface showing formation of an intracellular vacuole filled with sec::GFP from a tube originating at the plasma membrane. Timepoints correspond to (c) t=0 s, (d) t=24 s, (e) t=36 s, (f) t=60 s. (g–i) Still frames from a time-lapse TIRF recording showing the upregulation of apical endosomal structures marked by endogenously tagged GFP::Rab5. A progressive increase in the number of apical Rab5 puncta between early (g), middle (h) and late (i) cellularization was observed. Scale bar, 5 μm. (j) Quantification of sec::GFP-positive endocytic structures (tubules and vacuoles) over the course of cellularization (Blue line) including s.d. (black bars). The early (yellow), mid- (green) and late (purple) stages of cellularization are highlighted. The number of internal sec::GFP-positive structures (tubules and vacuoles) was quantified in five independent z sections separated by 0.2 μm, in nine separate 625 μm2 surface regions, from three embryos. P-value=1.0 × 10⁻⁶ (ANOVA). (k) Quantification of endogenously tagged Rab5 endosomes at the apical surface over the course of cellularization. The early (yellow), mid- (green), and late (purple) stages of cellularization are highlighted. GFP::Rab5 signal intensity is represented as the normalized number of Rab5 particles versus time (dark blue line) including s.d. (light blue bars). n=3 embryos. P-value=2.2 × 10⁻¹⁶ (t-test).

