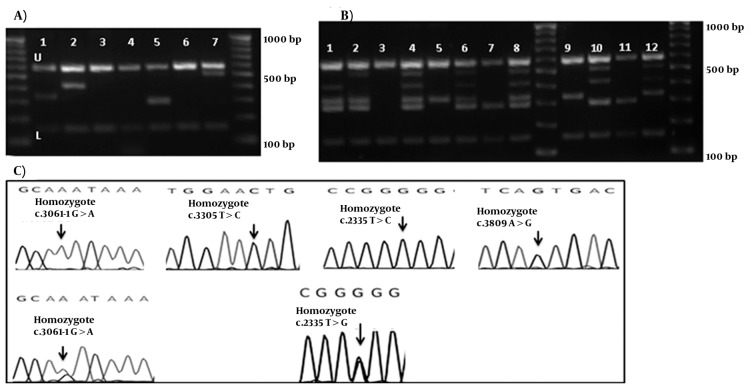
Figure 2. Chromatograms and gel Electrophoresis Images of the Mutation and the DNA Bands of Set 2 and 2A.
(A) Gel electrophoresis of Set 1, U: upper and L: lower controls are depicted for all lines. 3rd, 4th, and 6th wells show bands for the normal DNA. 100bp DNA ladder is depicted in right and left. Using Mix Set 2, Samples in 1st, 2nd, 5th, and 7th wells show the band for c.3061-1G > A, c.3305T > C, c.2335T > G, and c.3809A > G mutations, respectively. (B) Gel electrophoresis of the DNA bands of the hetero- and homozygote c.2335T > G, and c.3061-1G > A mutations. 1: the normal DNA with Set 2A. 2 and 3: heterozygotec.3061-1G > A mutation. 4 and 5: heterozygote c.2335T > G mutation; 6 and 7: homozygote c.3061-1G > A mutation. 8 and 9: homozygote c.2335T > G. 100bp DNA ladder is depicted in middle and left. (C) Chromatograms of main mutation detected in Set 1.

