
Fig. 1.
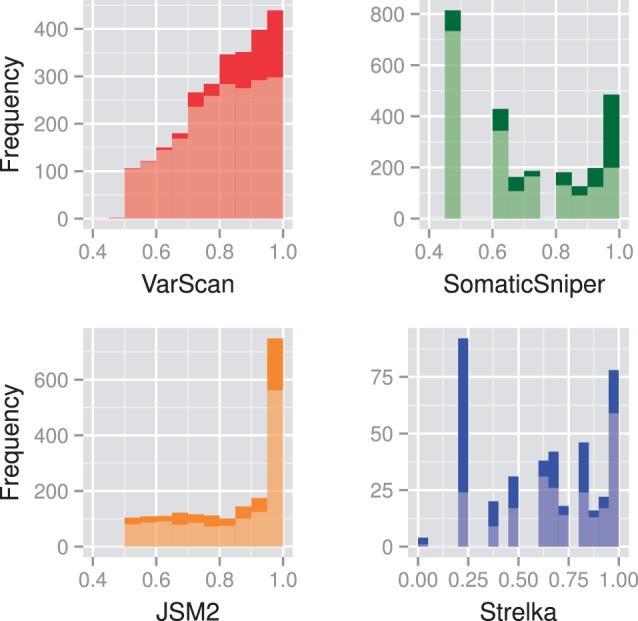
Frequency distribution of probability scores for somatic candidates in the raw output from the CML exome, with sites unique to each caller in a light shade and sites returned by multiple callers in a dark shade. Note that gaps between SomaticSniper and Strelka frequency peaks are an artefact due to the phred scaling used by these tools