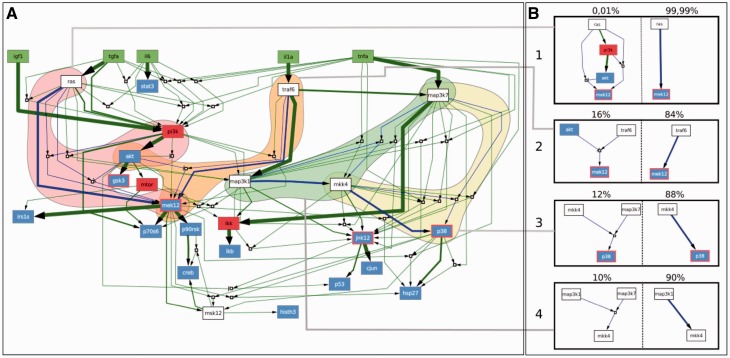
Fig. 2.
Suboptimal models generated with caspo with 10% error tolerance. (A) Network of the union of 11 700 suboptimal models. Green nodes represent ligands that are experimentally stimulated. Red (or red-bordered) nodes represent those species that are inhibited with a small molecule inhibitor (drug). Blue nodes represent species that were measured using the Luminex technology. White nodes are neither measured nor perturbed. AND gates in the models are represented by empty boxes. The thickness of the hyperedges correspond to their frequencies among the 11 700 submodels. (B) Four pairs of mutually exclusive modules (blue hyperedges in A) and their corresponding frequencies on top. These modules determine the behavior of three nodes in the network: mek12, mkk4 and p38

