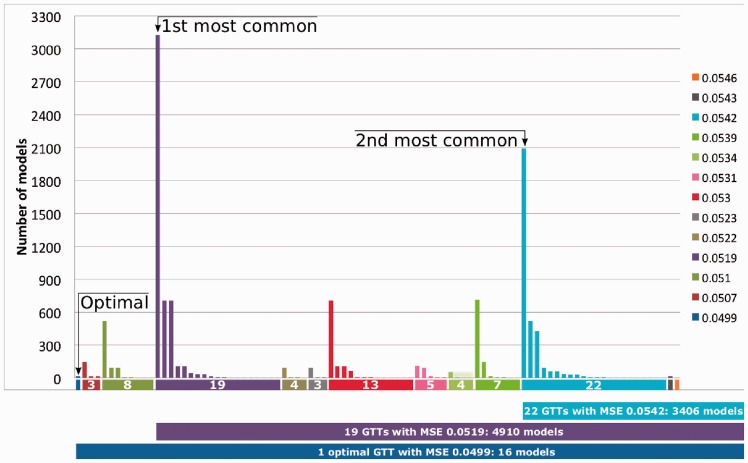
Fig. 4.
Distribution of suboptimal models. The suboptimal models are ordered (from left to right) first according to their MSEs, and then according to their 91 GTTs. The number of different models leading to the same GTT is plotted in vertical bars. GTTs are ordered and colored by their MSE. The 16 optimal models correspond to MSE 0.0499. The two most common GTTs describe the response of 3126 and 2090 models

