
Fig. 5.
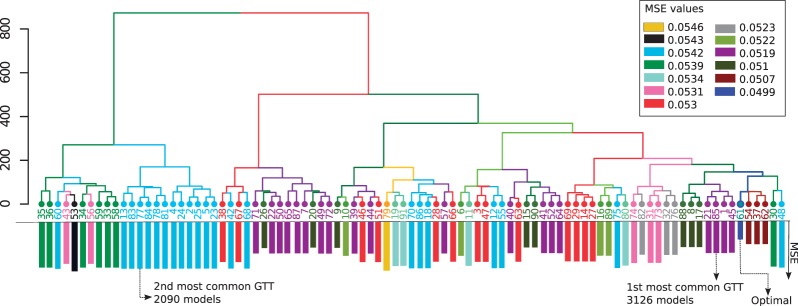
Hierarchical clustering of GTTs. Hierarchical clustering of the 91 GTTs based on their predictions for the readouts across all experimental conditions. Bars length on the leafs represents the corresponding MSE value for each GTT. The optimal GTT (61) is highlighted, as well as the two most common ones (85 and 77). The most common GTT is close to the optimal one, whereas the second most common GTT has a different behavior