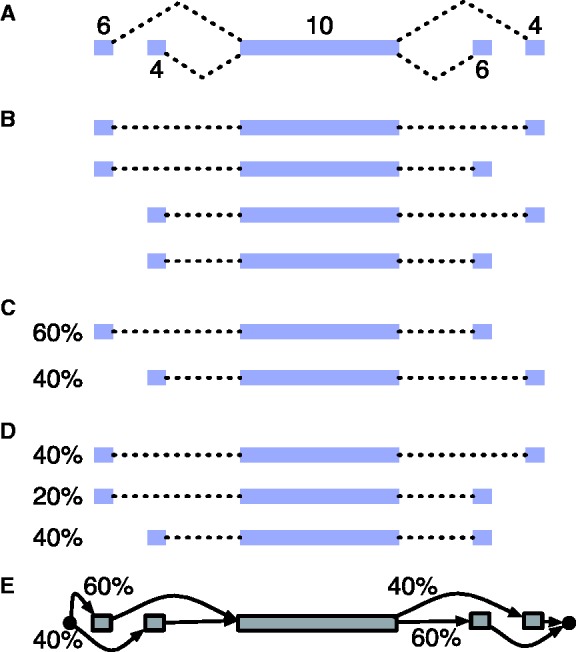
Fig. 1.

An example gene for which an explicit model of all possible isoform frequencies is not identifiable, whereas a PSG model for the gene is identifiable, given RNA-Seq reads. We assume that the RNA-Seq fragments are shorter than the middle exon and thus that reads from a fragment identify at most one splice junction. (A) The gene model with levels of coverage by RNA-Seq reads indicated above each exon. (B) The four possible isoforms of the gene. (C) and (D) give two (of infinitely many) possible isoform abundances that explain the observed RNA-Seq read coverages equally well. (E) The exon graph PSG for the gene, which is identifiable given this data (the unique ML parameters are above each edge), assuming the exon sequences are relatively unique
