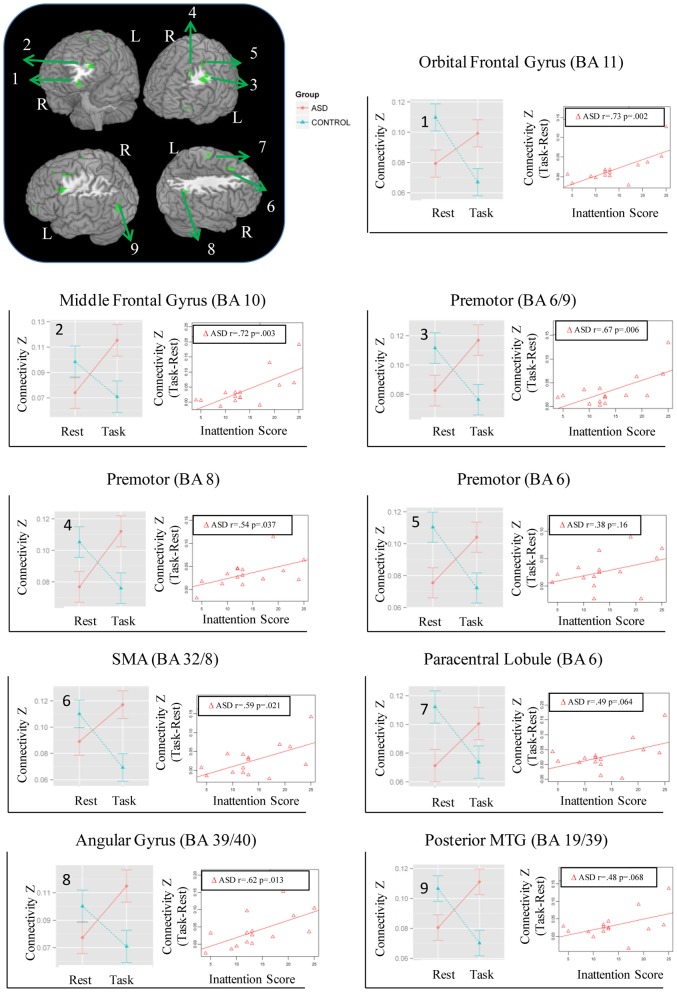
Figure 1.
Regions showing Group × State interaction for distant connectivity. Each region is identified with a number on the brain image in the top left corner. The corresponding graphs showing the interaction and correlation with inattention scores in the ASD group are identified with the same number.

