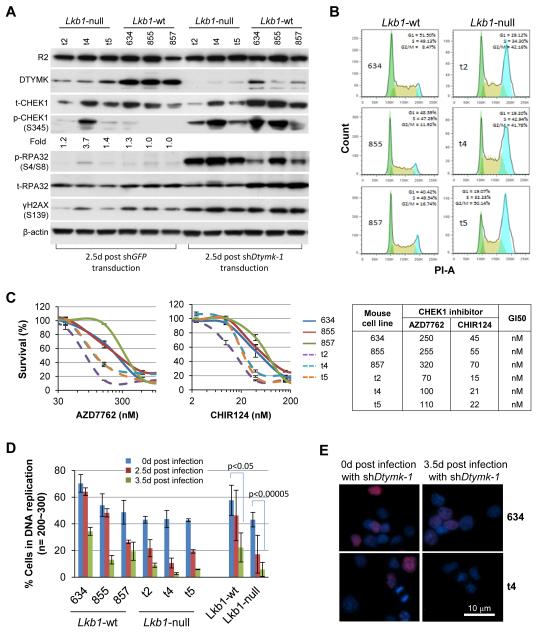
Figure 3. Characterizations of Lkb1-wt and Lkb1-null cell lines.
A, Western blot analyses of the indicated protein expression in Lkb1-wt (634, 855, and 857) and Lkb1-null (t2, t4, and t5) cell liens after shDtymk-1 knockdown. Phospho-CHEK1 Western blot bands were quantified by ImageJ.
B, Lkb1-wt (634, 855, and 857) and Lkb1-null (t2, t4, and t5) cell lines in log-phase growth were fixed with cold 70% ethanol, stained with PI, and then analyzed with flow cytometry. 20,000 cells per line were analyzed.
C, Lkb1-wt (634, 855, and 857) and Lkb1-null (t2, t4, and t5) cell lines were plated into 96-well plates at 2000 cells/well in 150 ml medium containing the indicated concentrations of AZD7762 or CHIR124 for 3 days. Viable cells were then counted with Dojindo’s Cell Counting Kit-8 assay. The data represent mean ± SD for 3 repeats. GI50 was calculated with GraphPad.
D, Lkb1-wt and Lkb1-null cells in 6-well plates were transduced with shDtymk-1. Two sets of the cells were plated into multiple chamber slides: one was 2 days and the other was 3 days post transduction. After overnight culturing, the cells were labeled with 100 μM IdU for 20 min then fixed for indirect immunofluorescence staining with anti-BrdU. The data represent mean ± SD for 200~300 cells.
E, Representative merged images from the cells stained with IdU (red) and DAPI (blue) as described in D are shown.

