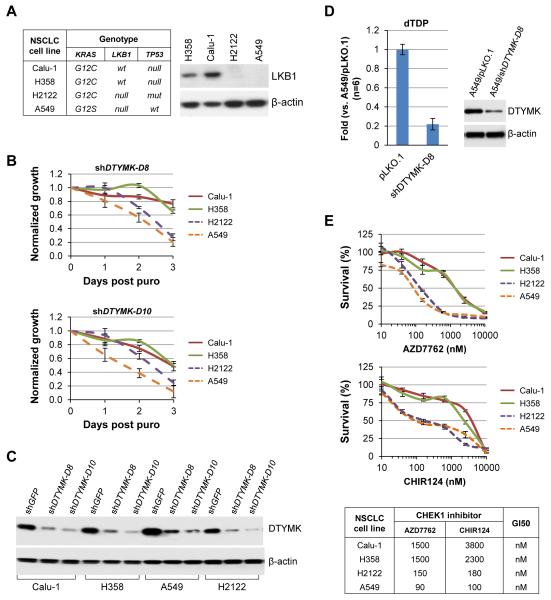
Figure 4. Knockdown of DTYMK in LKB1-wt and LKB1-mutant NSCLC cell lines.
A, Western blot analyses of LKB1 expression in LKB1-wt (H358 and Calu-1) and LKB1-deficient (H2122 and A549) NSCLC cell lines.
B, LKB1-wt (H358 and Calu-1) and LKB1-deficient (H2122 and A549) NSCLC cell lines were transduced with the indicated shRNAs for 1 day and then selected with 5 μg/ml puromycin (puro) for 2 days in 6-well plates. The cells were collected by trypsin and re-plated into 96-well plates at 2000 cells/well in 150 μl medium containing 5 μg/ml puromycin (puro) and measured daily using Promega’s CellTiter-Glo Assay. The data represent mean ± SD for 3 replicates. The cells left from the re-plating were lysed for Western blot analysis of DTYMK expression (C).
D, Graph of dTDP levels in A549 cells transduced with the indicated shRNA for 4 days. The data represent mean ± SD for 6 replicates. Expression of DTYMK in these cells at the time of metabolite extraction was determined by Western blotting.
E, LKB1-wt (H358 and Calu-1) and LKB1-deficient (H2122 and A549) NSCLC cell lines were plated into 96-well plates at 2000 cells/well in 150 ml medium containing the indicated concentrations of AZD7762 or CHIR124 for 3 days. Viable cells were counted daily using Dojindo’s Cell Counting Kit-8 Assay. The data represent mean ± SD for 3 repeats. GI50 was calculated with GraphPad.

