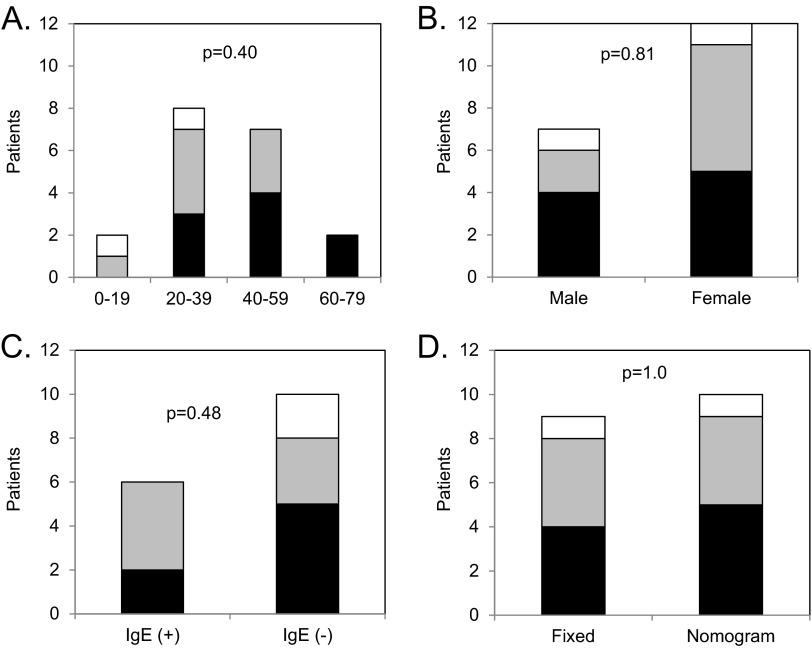
Figure 1.
Response patterns to omalizumab. The number of patients on y-axis with complete (black bar), partial (gray bar), or no (white bar) response are shown for subgroups separated based on (A) age, (B), gender, (C) IgE level, and (D) dosing protocol. The p values for statistical comparison of response patterns are shown in each panel.

