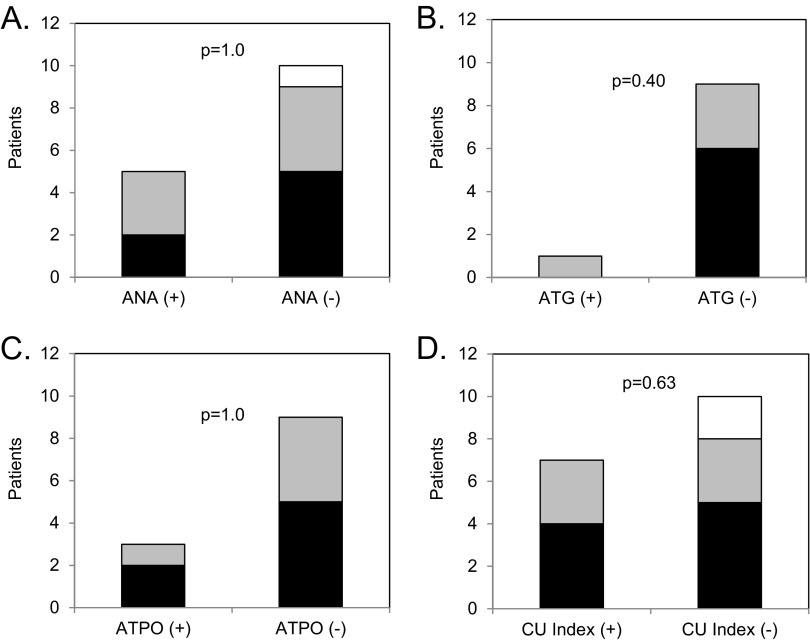
Figure 2.
Response patterns of omalizumab to individual autoimmune markers. The number of patients on y-axis with complete (black bar), partial (gray bar), or no (white bar) response are shown for subgroups separated based on (A) antinuclear antibody (ANA), (B) antithyroglobulin (ATG), (C) antithyroperoxidase (ATPO), and (D) chronic urticaria (CU) index. Positive (+) and negative (−) for ANA, ATPO, ATG, and CU index were based on standards from the respective testing laboratory. The p values for statistical comparison of response patterns are shown in each panel.

