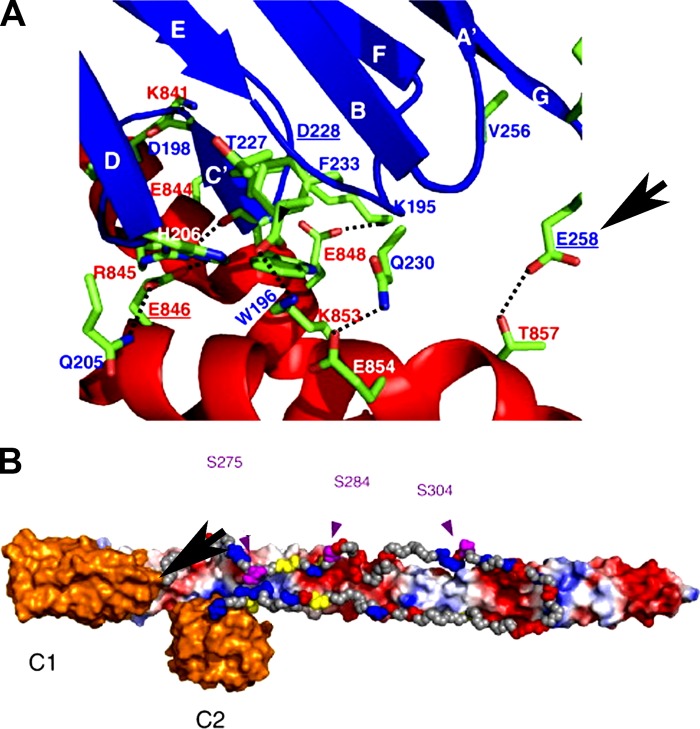
Figure 7.
Model of the interaction between cMyBP-C C1-C2 and the distal 126 aa of S2. (A) Detailed view of the interactions of C1 and S2. C1 is shown in blue and S2 is shown in red. Important side chains in the interaction are colored by atom type (carbon, green; oxygen, red; nitrogen, blue), and amino acid labels are colored by protein. Amino acids at the C1–S2 interface that, when mutated, are implicated in the pathogenesis of HCM are underlined, and the position of the cMyBP-C E258K mutation is highlighted by the arrow. (B) Diagrammatic representation of the proposed orientation of the C1C2 region of cMyBP-C on S2. Domains C1 and C2 of MyBP-C are shown in orange and the MyBPC-motif in gray. The three phosphorylation sites in the linker are shown in purple, residues in the MyBPC-motif mutated in HCM are shown in yellow with labels, and charged residues are colored according to their charge. S2 is shown with solvent-accessible surface colored by a simple electrostatic potential with the N terminus on the left (hidden by C1) and the C terminus on the right. Reproduced from Ababou et al. (2008) with permission from Elsevier.

