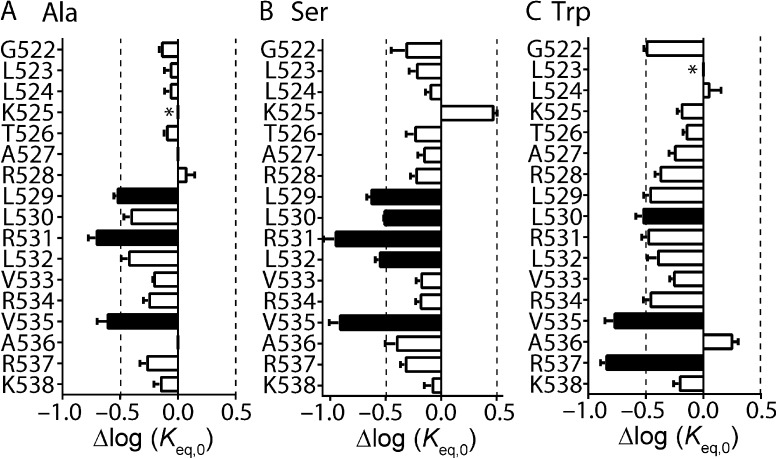
Figure 2.
Scanning mutagenesis of the Kv11.1 channel S4 helix. (A–C) Shifts, relative to WT, in log(Keq,0) values for alanine (A), serine (B), and tryptophan (C) mutagenesis scans of S4 residues spanning from Gly522 to Lys538. Data are presented as means ± SEM for n = 3–20 cells (see Table S1). Dashed lines indicate Δlog(Keq,0) > ±0.5 log units, which has been shown previously to be the minimum perturbation required to derive an accurate Φ-value (Cymes et al., 2002; Wang et al., 2011). Mutations that fulfill this minimum requirement are indicated by closed bars, whereas mutations with Δlog(Keq,0) < 0.5 log units are indicated by open bars. *, mutant channels that failed to express or expressed poorly.

