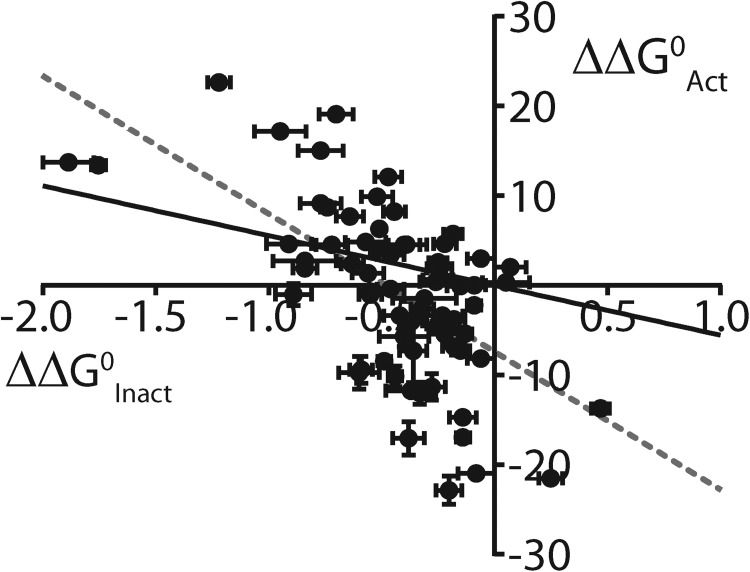
Figure 6.
Perturbations to inactivation gating and activation gating show poor correlation for S4 residue mutations. Plot comparing perturbations to ΔG0, versus WT, of inactivation gating (ΔΔG0Inact, represented by Δlog(Keq,0)) compared with perturbations to ΔG0, versus WT, of activation gating (ΔΔG0Activ; see Materials and methods) for each S4 residue mutation. Solid black line represents linear regression analysis constrained to go through WT, whereas dashed gray line is an unconstrained fit (R2 = 0.38).

