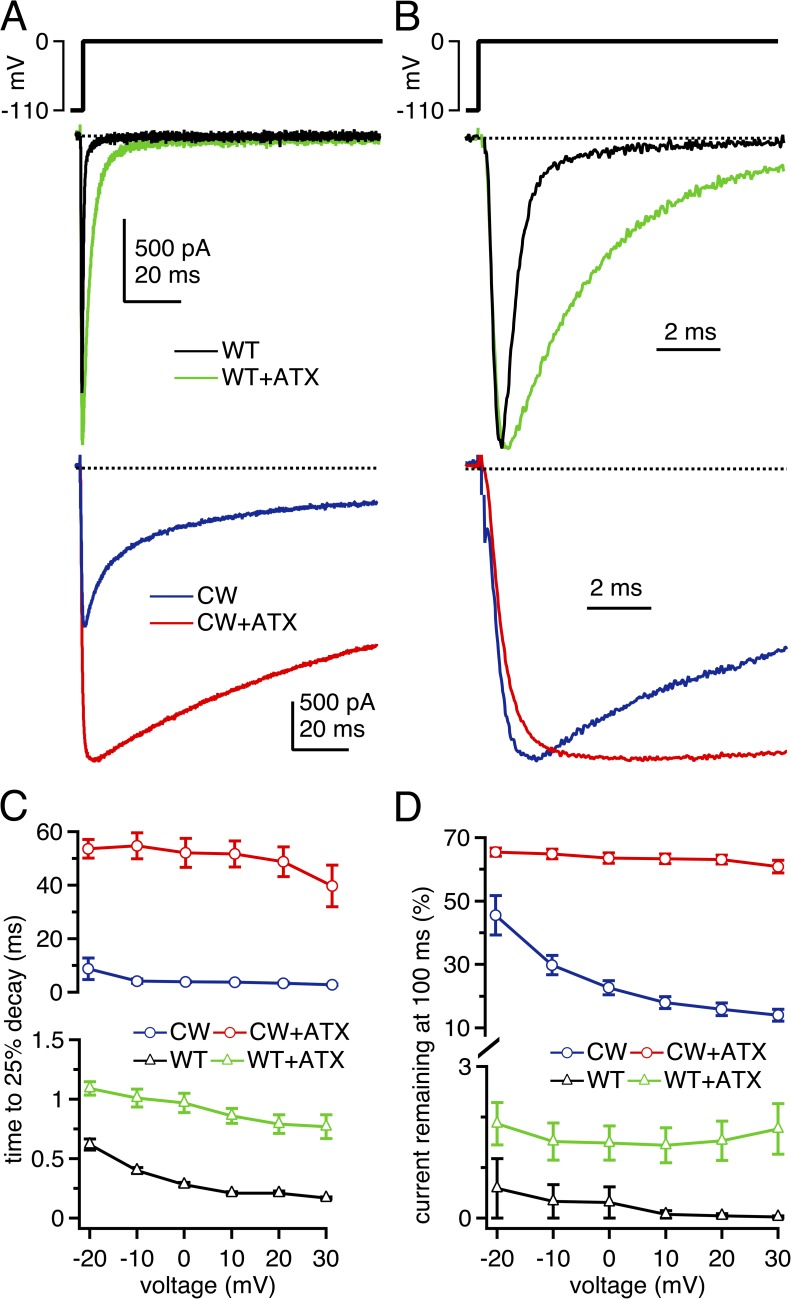
Figure 1.
Macroscopic Na currents through WT, CW, and ATX-modified NaV1.4 channels. (A; top) Voltage protocol. (Middle) Representative whole cell voltage-clamped Na currents through WT NaV1.4 channels in control solutions (black) and with 500 nM ATX applied extracellularly (green). (Bottom) Representative Na currents through NaV1.4 L443C/A444W (CW) channels in control solutions (blue) and with ATX (red). (B) Currents as in A, except normalized to peak. (C) Mean decay rate of Na currents as a function of voltage, measured as time for currents to decay by 25% of the peak current amplitude. Note different scales on upper and lower graphs. (D) Mean current remaining after 100 ms of depolarization, measured over last 1 ms of voltage step, relative to the peak transient current at that voltage. Within-cell comparisons ±ATX for each cell; WT, n = 6; CW, n = 5.

