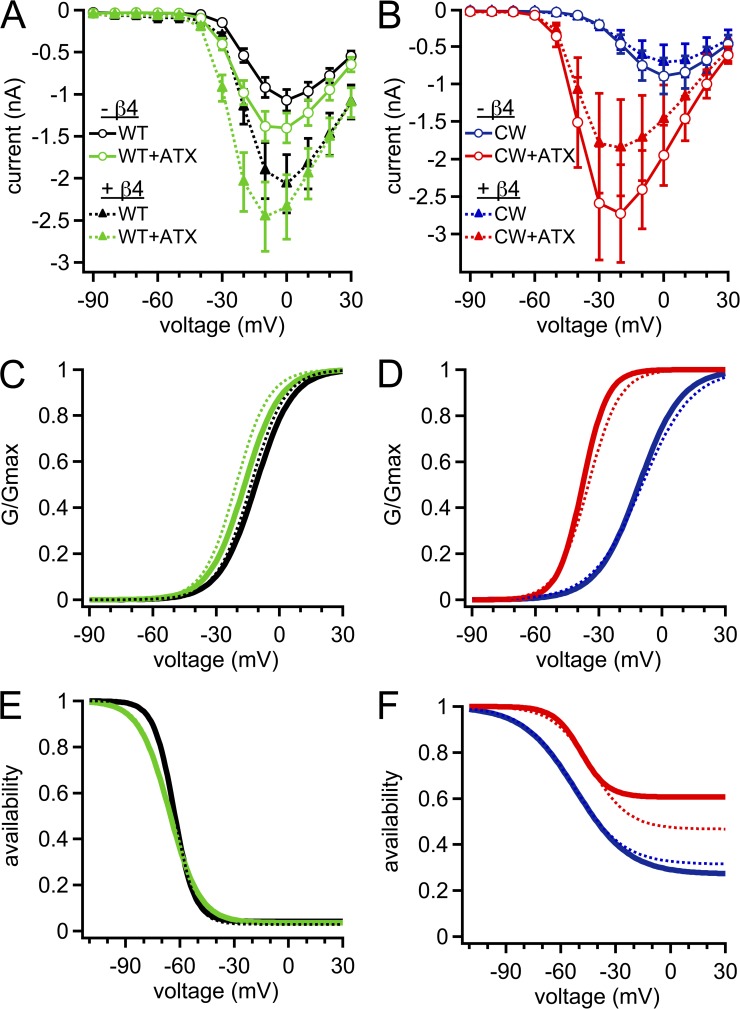
Figure 2.
Activation and inactivation properties of WT, CW, and ATX-modified Na channels. (A) Mean current–voltage relation for WT (black) and ATX-modified WT (green) Na channels. In all panels, solid lines are without the β4 peptide, and dotted lines are with the β4 peptide. (B) Mean current–voltage relation for CW (blue) and ATX-modified (red) CW Na channels. (C) Peak conductance curve for WT and ATX-modified WT channels; Boltzmann function with mean V1/2 and k parameters. (D) As in C, for CW and ATX-modified CW channels. (E) Steady-state inactivation curves for WT channels ±ATX; Boltzmann function with mean V1/2, k, and steady-state parameters. (F) As in E, for CW channels ±ATX. Within-cell comparisons ±ATX for each cell; WT, n = 6; CW, n = 5.

