Figure 1.
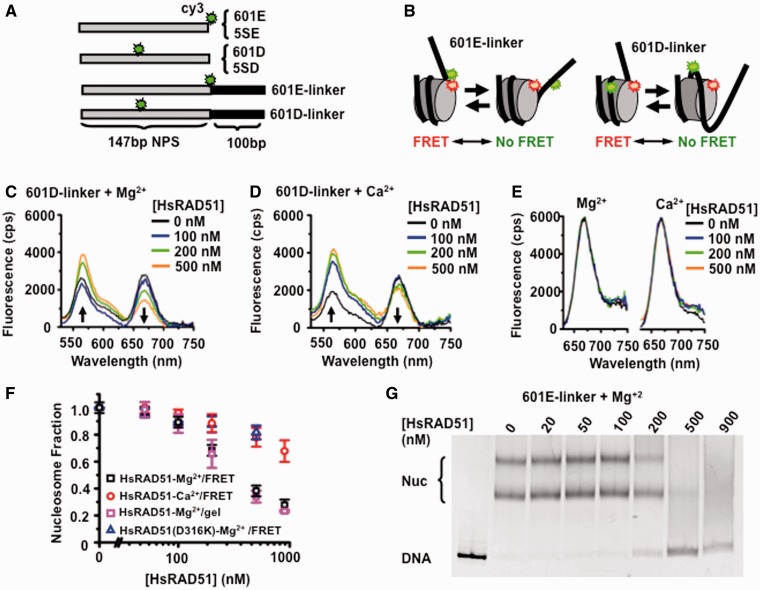
HsRAD51 alters nucleosome positioning. (A) Diagram of Cy3-labeled DNA’s containing either the 147 bp 601 or Xenopus 5S rDNA NPS with a 100 bp linker that may be used for quantifying HsRAD51 interactions with a nucleosome. (B) Schematic of the FRET system using the Cy3-labeled 601E-linker (left) or 601D-linker (right) DNAs reconstituted into nucleosomes with Cy5-labeled HO. The nucleotide position of the Cy3 fluorophore is shown in Supplementary Table S1, whereas the Cy5 fluorophore was linked to H2A(K119C) by maleimide chemistry to the HO. Spatial positioning of the Cy3 and Cy5 fluorophores on the nucleosome crystal structure is shown in Supplementary Figure S1B. (C) Representative fluorescence emission spectra of 601D-linker nucleosomes (12 nM) excited at 510 nM in the presence 130 mM KCl, ATP (250 µM) and 2 mM MgCl2 (Mg2+) with HsRAD51 at 0 (black), 100 (blue), 200 (green) and 500 nM (orange). (D) Representative fluorescence emission spectra of 601D-linker nucleosomes (12 nM) excited at 510 nM in the presence 130 mM KCl, ATP (250 µM) and 2 mM CaCl2 (Ca2+) with HsRAD51 at 0 (black), 100 (blue), 200 (green) and 500 nM (orange). (E) Fluorescence emission spectra of 601D-linker nucleosomes (12 nM) excited at 610 nM in the presence 130 mM KCl, ATP (250 µM) and 2 mM Mg2+ (left) or 2 mM Ca2+ (right) and incubated with hsRAD51 at 0 (black), 100 (blue), 200 (green) and 500 nM (orange). (F) Normalized nucleosome fraction as a function of HsRAD51 concentration. HsRad51 + 2 mM Mg2+ (black open square), HsRad51 + 2 mM Ca2+ (red open circle) and HsRad51(D316K) + 2 mM Mg2+ (open triangle), normalized nucleosome fraction determined by gel shift analysis for HsRad51 + 2 mM Mg2+ (pink open square). Each point represents the average and standard deviation from at least three independent experiments. (G) Gel analysis of nucleosome disassembly. 601E-linker nucleosomes (10 nM) were incubated with indicated concentration of HsRAD51, ATP (250 µM) and 2 mM Mg2+. Multiple bands are the results of at least two populations of nucleosomes that occur with tailed positioning DNAs; where the histone octomer may deviate from the consensus positioning sequence. The average fraction of nucleosome DNA (Nuc) from at least three independent experiments was determined by densitometry (Typhoon), normalized and plotted in Panel (F).

