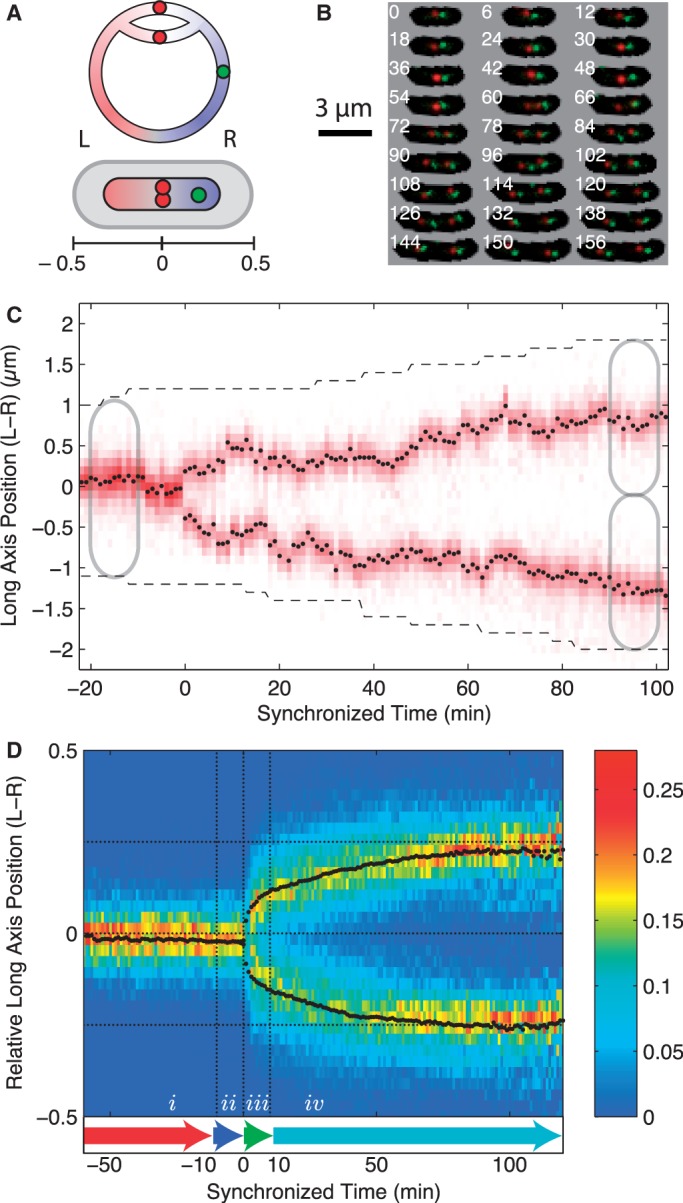
Figure 1.

(A) Schematic of the bi-directional replicating circular E. coli chromosome and the chromosome conformation in the cell. Before the initiation of segregation, oriC (red focus) is positioned at mid-cell with the left arm of the chromosome on the left side of the cell and the right arm of the chromosome on the right side of the cell. The chromosomal orientation is measured using the position of a second locus (green focus) on the right arm of the chromosome. The relative long-axis position of foci in the cell is measured relative to cell length from mid-cell. (B) Frame mosaic of a typical cell cycle (every 6th frame shown for clarity). An array of phase-contrast/fluorescence composite images shows the red (oriC) and green (fiducial) fluorescent foci and the cell mask as a function of time (min) since cell division, which is shown in the top left corner of each image. (C) Kymograph for a typical cell shows red fluorescence intensity along the long axis of the cell as a function of time since the splitting of the oriC locus. The black points show the fit oriC long-axis position of the focus relative to mid-cell as a function of time (min). The black dashed line shows the cell poles. (D) Locus position occupancy (heat map) and mean trajectory (black points) of oriC as a function of relative cellular position for 406 independent cell cycles synchronized to the oriC split (t = 0). Dotted horizontal lines show the approximate home positions of the oriC locus before and after segregation. Locus dynamics are organized into four time intervals of motion: (i) Pre-Replication; (ii) Cohesion; (iii) Rapid-Translocation; and (iv) Post-Segregation for analysis.
