Figure 2.
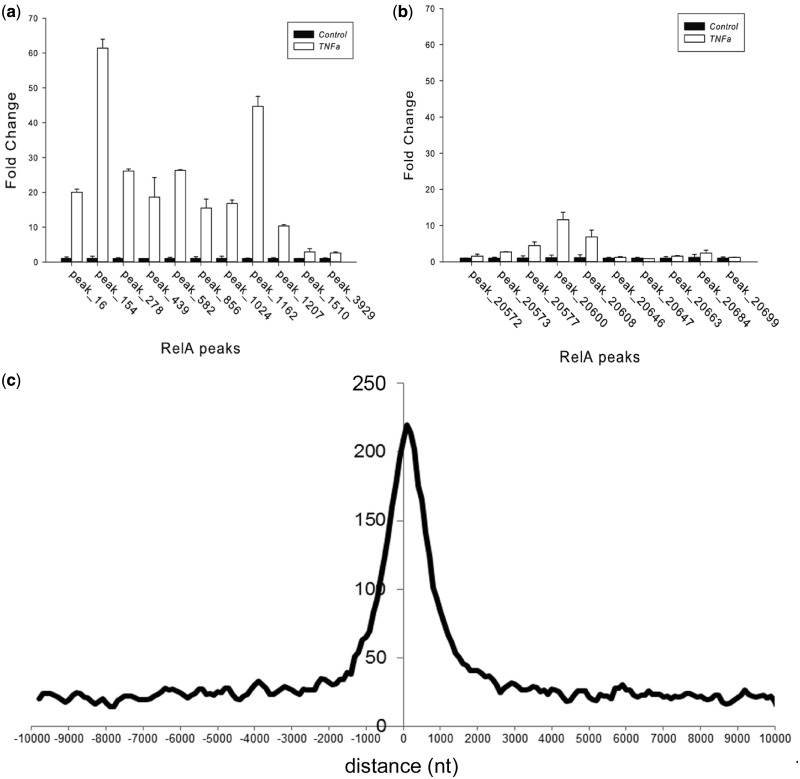
Q-gPCR target validation. (A) Eleven novel MACS peaks with the top 20% significance scores were selected for validation (scores >200, Supplementary Table S2). A549 cells were stimulated in the absence or presence of TNF (30 ng/ml, 30 min) and subjected to XChIP. Sheared chromatin was immunoprecipitated with anti-RelA Ab. Shown are Q-gPCR assays for expressed as fold change relative to unstimulated cells for each peak. Primer sequences are given in Supplementary Table S2. A strong (>2-fold) TNF inducible enrichment was observed for each peak analyzed. Here, 11 of 11 MACS peaks were validated successfully (false-positive rate is estimated <6%). (B) Ten novel MACS peaks with significance scores <20% were selected for validation (scores <50, Supplementary Table S2). Chromatin from control or TNF stimulated subjected to XChIP, immunoprecipitated with anti-RelA Ab and Q-gPCR performed for each indicated MACS peak. Five peaks show enrichment of >2-fold relative to control chromatin. Primer sequences are given in Supplementary Table S2. (C) Distribution of NF-κB/RelA peaks relative to TSS. Shown is a histogram of the distances of NF-κB/RelA summits to the primary TSS of known genes. Based on this histogram, we used a distance of ±2 kb from the peak summit to the TSS as a threshold for traditional method of defining regulated genes.

