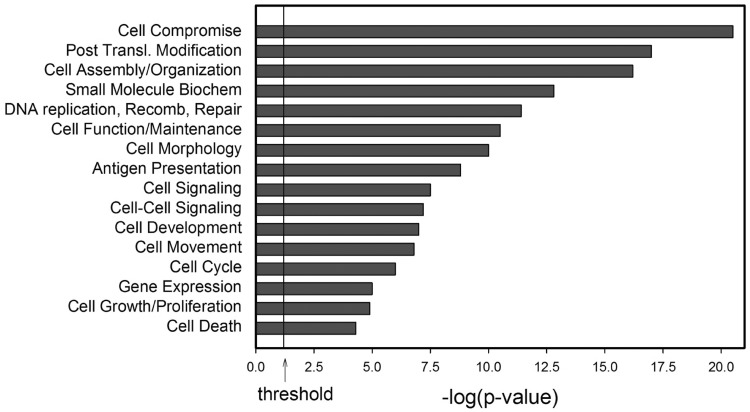
Figure 3.
Genome Ontology. Shown are the molecular functions of 787 genes within 2 kb of the top 20% MACS peaks by Ingenuity Pathways Analysis (www.ingenuity.com). The y-axis is the molecular function; x-axis is −log(P-value) for the enrichment of that activity over the human genome.

