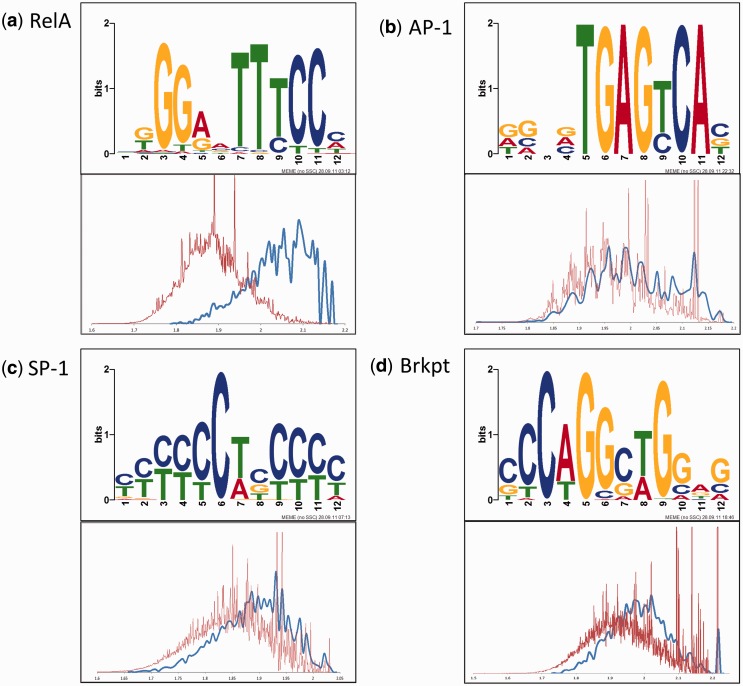
Figure 4.
Motif enrichment. Shown are the weblogos for four primary cis-regulatory motifs of 12-nt length identified in the MACS peaks (a–d, motifs of NF-κB/RelA, AP1, gapped SP1, break point and their validation histogram, respectively). The blue line depicts the distribution of the likelihood scores (based on log-transformed position weight matrix) for a given motif to occur among the top 20% of the RelA Chip-Seq peaks ChIP peaks, and the red line depicts the same distribution for the whole genome. For each motif, the validation histogram is plotted, which clearly shows that the given motif is genuinely enriched in RelA peaks as compared with the whole human genome. The motifs denoted as depleted in Table 2 do not pass this test.

