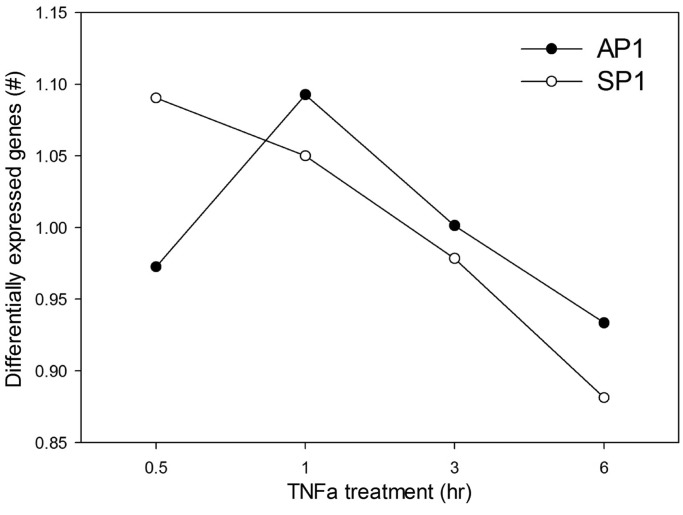
Figure 7.
Expression patterns of genes controlled with RelA-AP1 or RelA-SP1 motifs. The total number of differentially expressed genes relative to unstimulated cells was derived from RNA-Seq of a time course experiment. The percentage of differentially expressed genes with AP1 or SP1 motif was calculated and normalized by the average percentage of genes with the given motif across all the time points.

