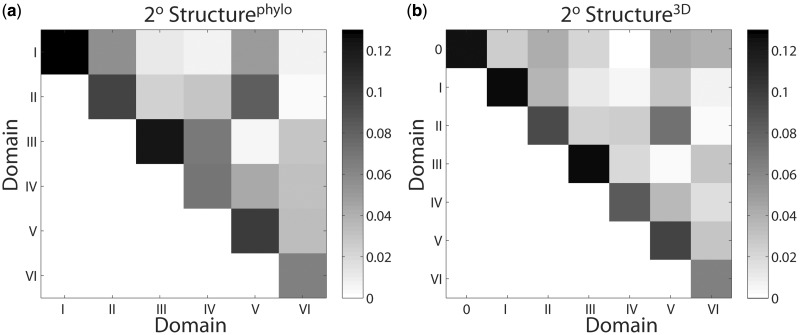
Figure 7.
Molecular interactions within the LSU, partitioned by rRNA domain for (a) 2° Structurephylo and (b) 2° Structure3D. The vertical and horizontal axes display the domain numbers. Scaled interaction frequencies were determined as the sum of the number of base–base, phosphate–RNA and RNA–Mg2+–RNA interactions, normalized by the average number of nucleotides in the domain pairs. Interaction frequencies were determined within domains (diagonal) and between domains (off-diagonal). The degree of shading indicates the frequencies of interaction within or between domains. The numerical values of the frequencies of interaction are given in Supplementary Tables S8 and S10.

