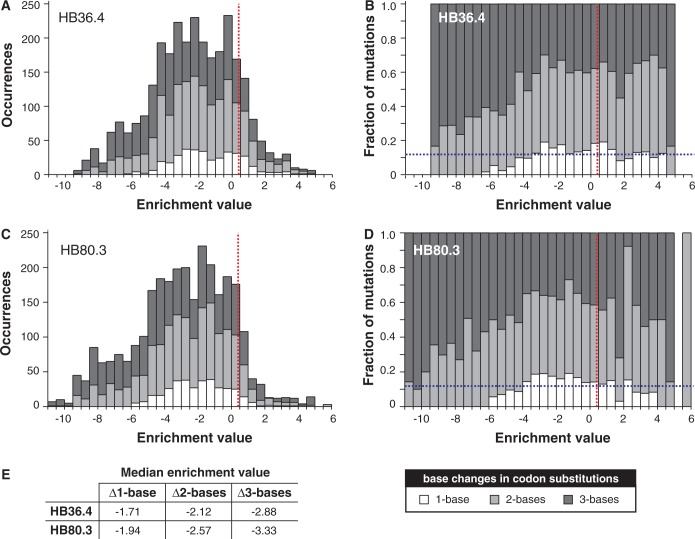
Figure 2.
Distribution of fitness effects of non-synonymous codon substitutions in (A and B) HB36.4 and (C and D) HB80.3. The distribution is partitioned into codon changes with 1-, 2- and 3-base changes. The red dashed vertical line indicates the enrichment value of the parental genes, and the blue dashed horizontal bar indicates the fraction of all possible mutations of the gene that are point mutations. Enrichment values for parental genes are slightly greater than zero because most mutations have a negative effect on fitness. (E) Median enrichment values for types of codon substitutions. Distributions based on codon enrichment values instead of amino acid enrichment values are provided in Supplementary Figure S1.

