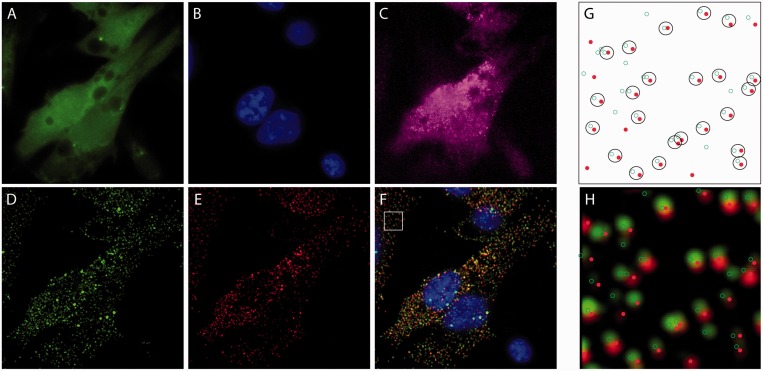
Figure 2.
Fluorescent images and analysis of HT1080 cells following RBMB delivery and smFISH. HT1080-GFP-96mer cells were microporated in the presence of 0.8 μM RBMBs and placed in the incubator for 5 h. The cells were then fixed and smFISH was performed. Wide-field fluorescent images of (A) GFP, (B) DAPI, (C) RBMB-reference dye (Alexa 750), (D) smFISH probes (TMR) and (E) RBMB-reporter dye (CF640R) were acquired. The images of the smFISH probes and the RBMB reporter dye shown are maximum intensity projections of 56-images within a z-stack. (F) A merged image that includes DAPI (blue) and the maximum intensity projections of smFISH probes (green) and the RBMB-reporter dye (red). A custom Matlab program was used to identify individual spots in the smFISH and RBMB-reporter channels and to calculate the percent colocalization between the two signals. (G) Example Matlab output, showing the smFISH (green circles) and RBMB-reporter (red dots) signals that were detected within the region outlined by a white box in panel F. Spots that were considered to be colocalized are enclosed within a black circle. Notably, the Matlab analysis was performed on the z-stacks (i.e. in three-dimensions) not on the maximum intensity projection images; however, a 2D representation is shown. (H) Overlay of the Matlab output and the merged image shows good correspondence between the two.

