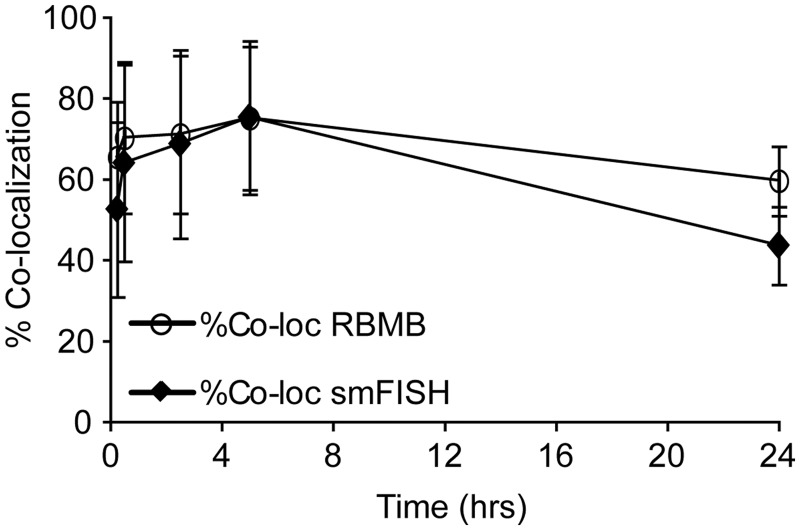
Figure 5.
Ability to detect single RNA transcripts by RBMBs as a function of time after microporation. HT1080-GFP-96mer cells were microporated in the presence of 0.8 μM RBMBs and placed in the incubator for 15 min, 30 min, 2 h, 5 h or 24 h. The cells were then fixed and smFISH was performed. A custom Matlab program was used to determine the percent of RBMB-reporter signals that were colocalized with smFISH signals and the number of smFISH signals that were colocalized with RBMB-reporter signals for each time point, on a cell-by-cell basis. Each data point represents the mean measurement of colocalization (±standard deviation) for at least 20 cells, collected from at least two independent experiments.

