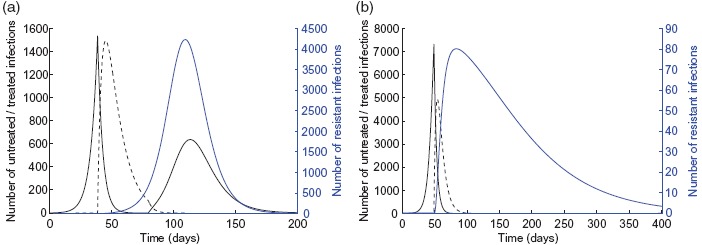
Figure 2.

Epidemic profiles with α = 10−3 and δR = 0.9 for (a) K = 10% and (b) K = 20%. Untreated, treated, and resistant infections are illustrated by the solid black, dashed black, and blue curves, respectively. Other parameter values are given in Table 1.
