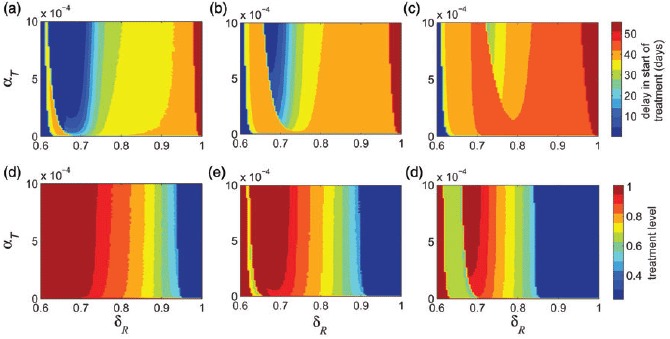
Figure 5.

Delay in start of treatment in the time-dependent profile as a function of δR and α to minimize the epidemic final size is shown for (a) K = 8%; (b) K = 12%; and (c) K = 16%. Optimal level in the constant treatment profile as a function of δR and α to minimize the epidemic final size is shown for (d) K = 8%; (e) K = 12%; and (f) K = 16%. Other parameter values are given in Table 1.
